Aruba Utilities is an Android application for WLAN engineers and experimenters. It combines measurements from the phone’s Wi-Fi radio, network stack and sensors with tools for querying network infrastructure. The aim is to help examine coverage, connectivity, handovers and performance from the device’s point of view.
The application includes Wi-Fi connection and BSSID history, channel views, controller and infrastructure clients, floorplan and survey functions, and networking tools such as Ping, DNS, mDNS and iPerf. Bluetooth, cellular and Wi-Fi ranging functions are available on supported devices. Some screens work on any WLAN; others require a compatible server and credentials.
Use the index to find a screen, then compare its screenshot with the explanation alongside it. The screen chapters follow the September 2026 navigation drawer. Presentation captures from March 2023 and earlier examples are dated; details may differ in current releases, and Android can limit scan and measurement availability.
Adapted from the Summary in Peter Thornycroft’s March 2023 presentation.
01 / APP SCREEN
Wi-Fi Monitor
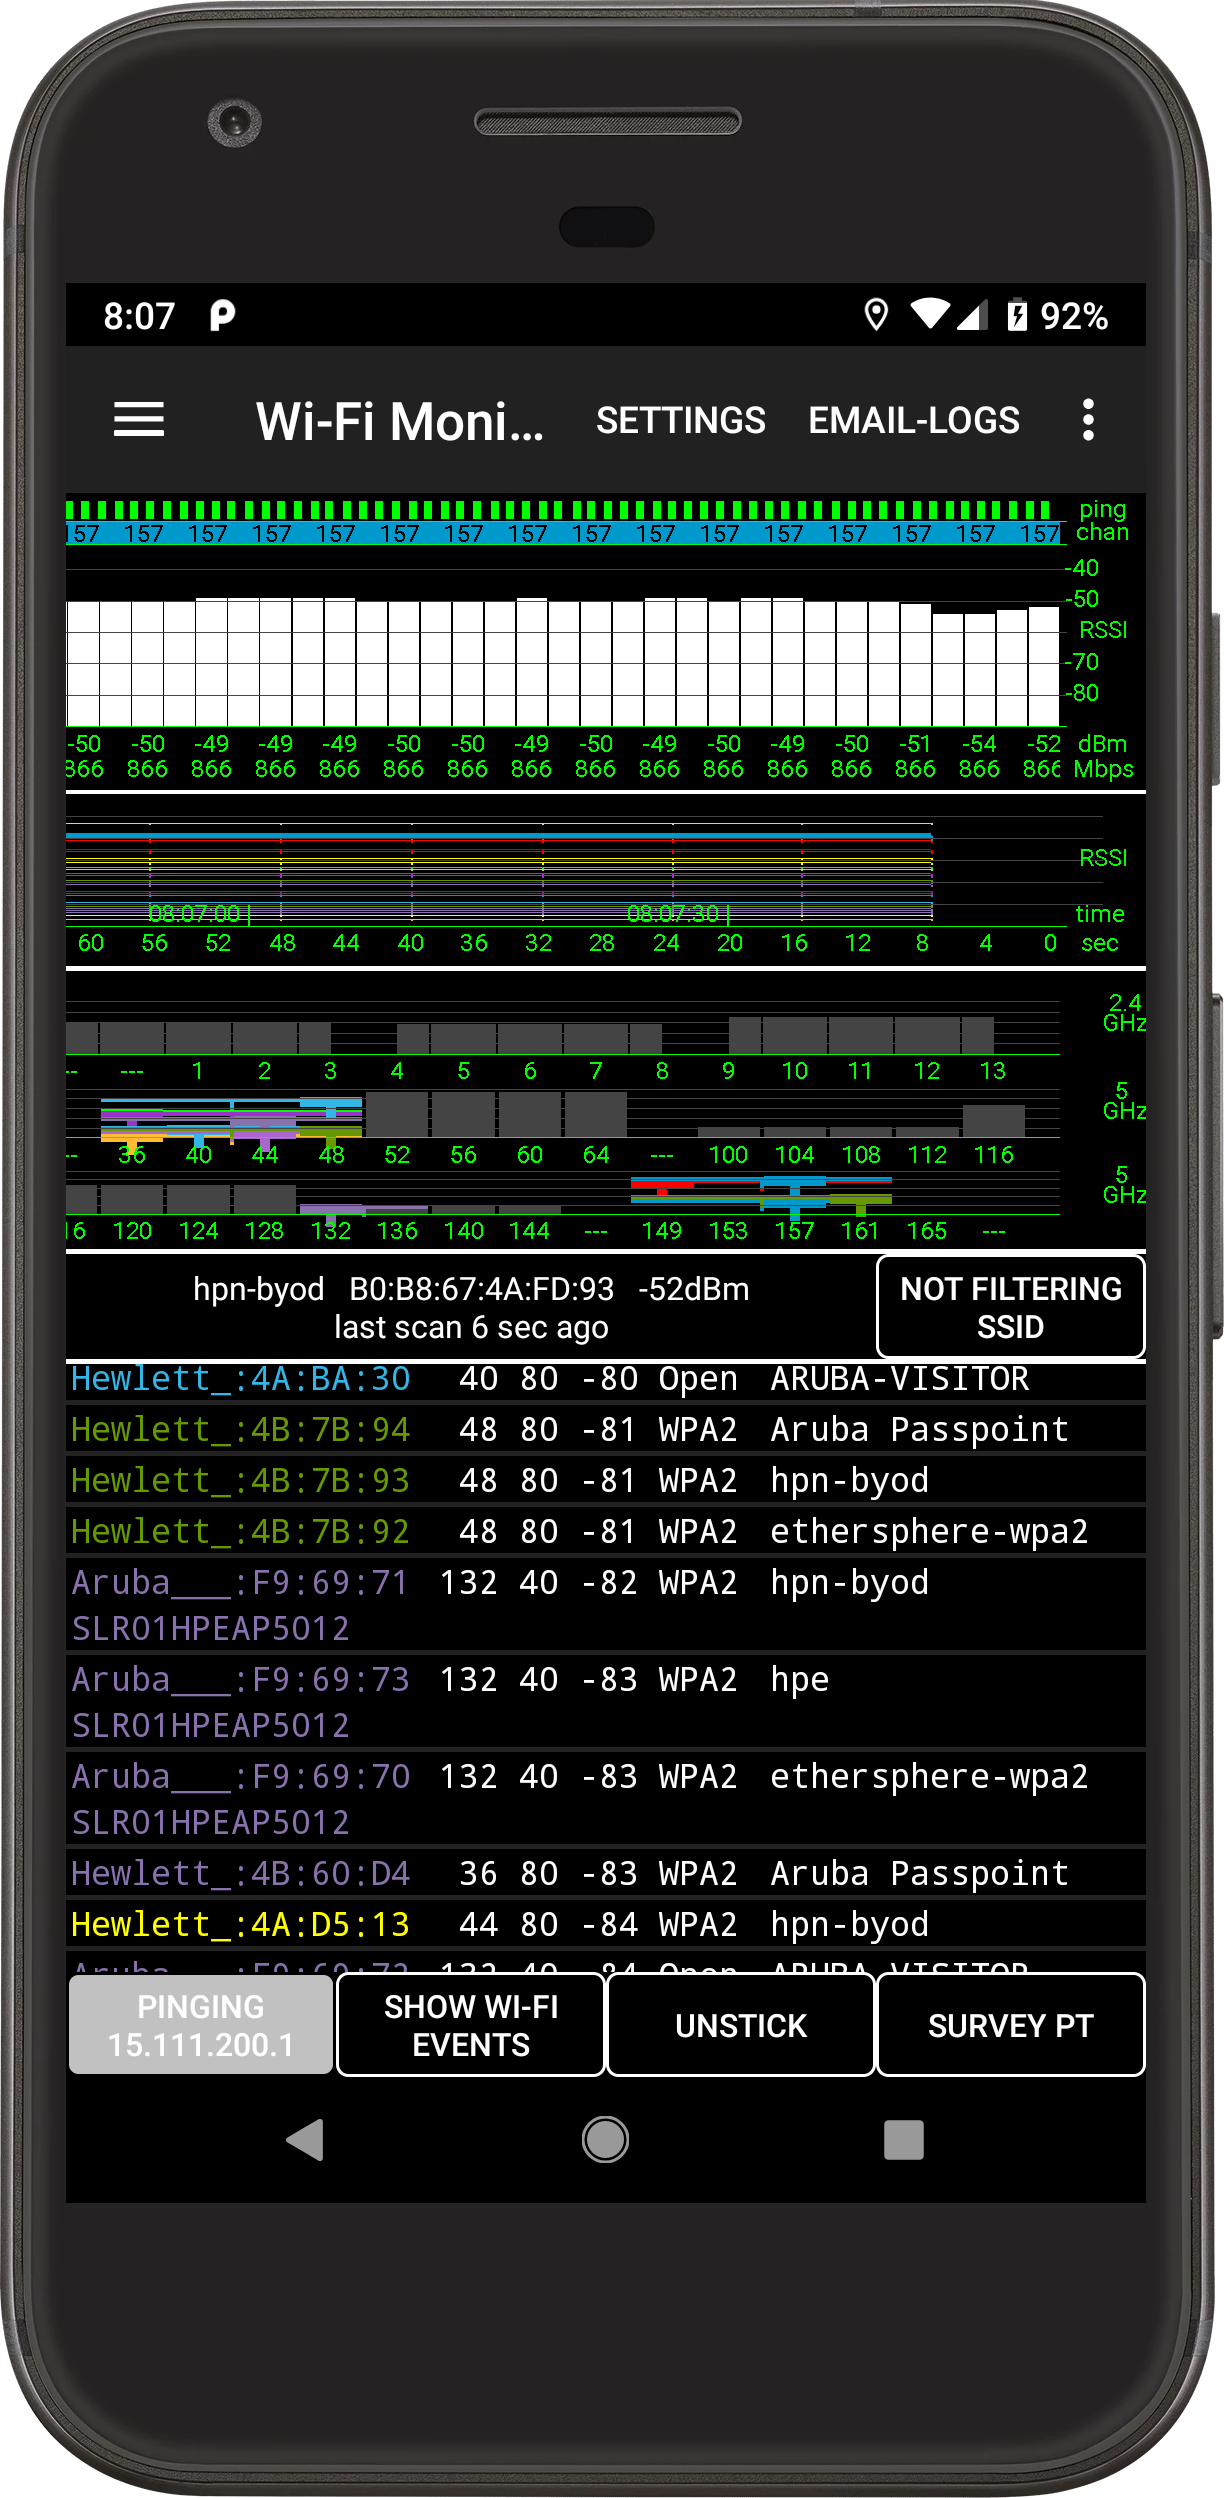
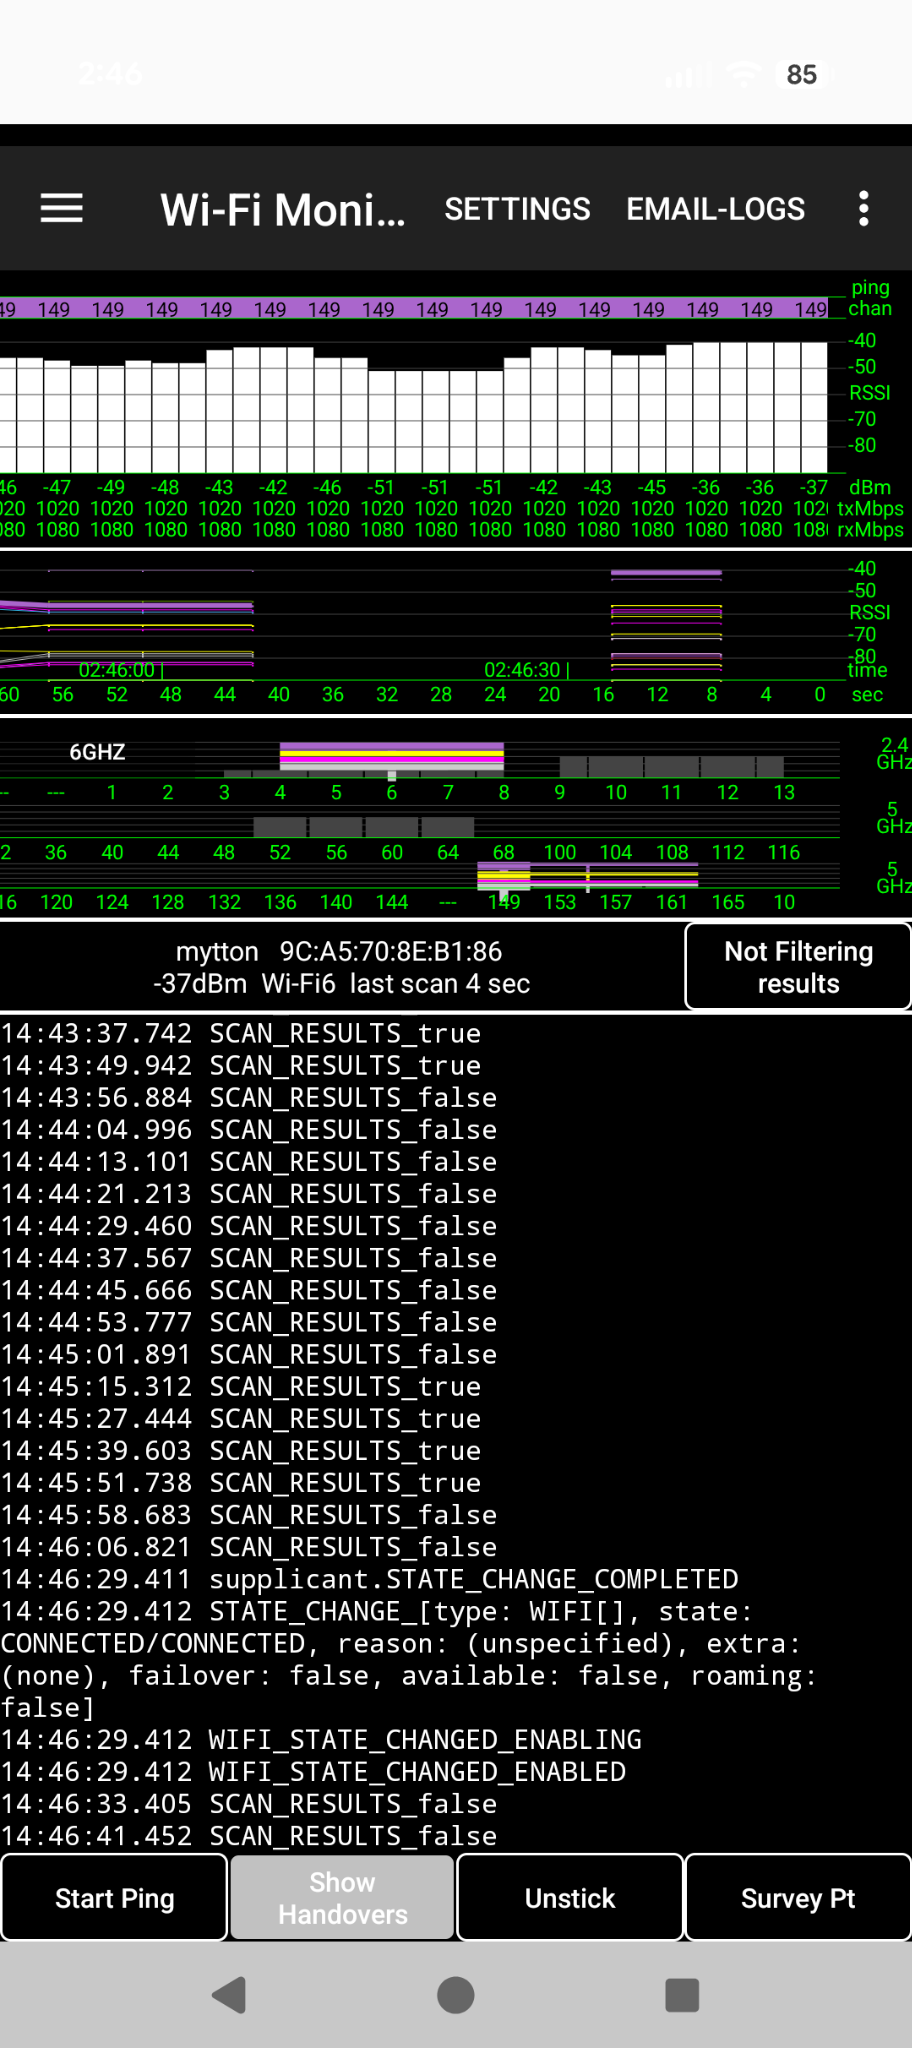
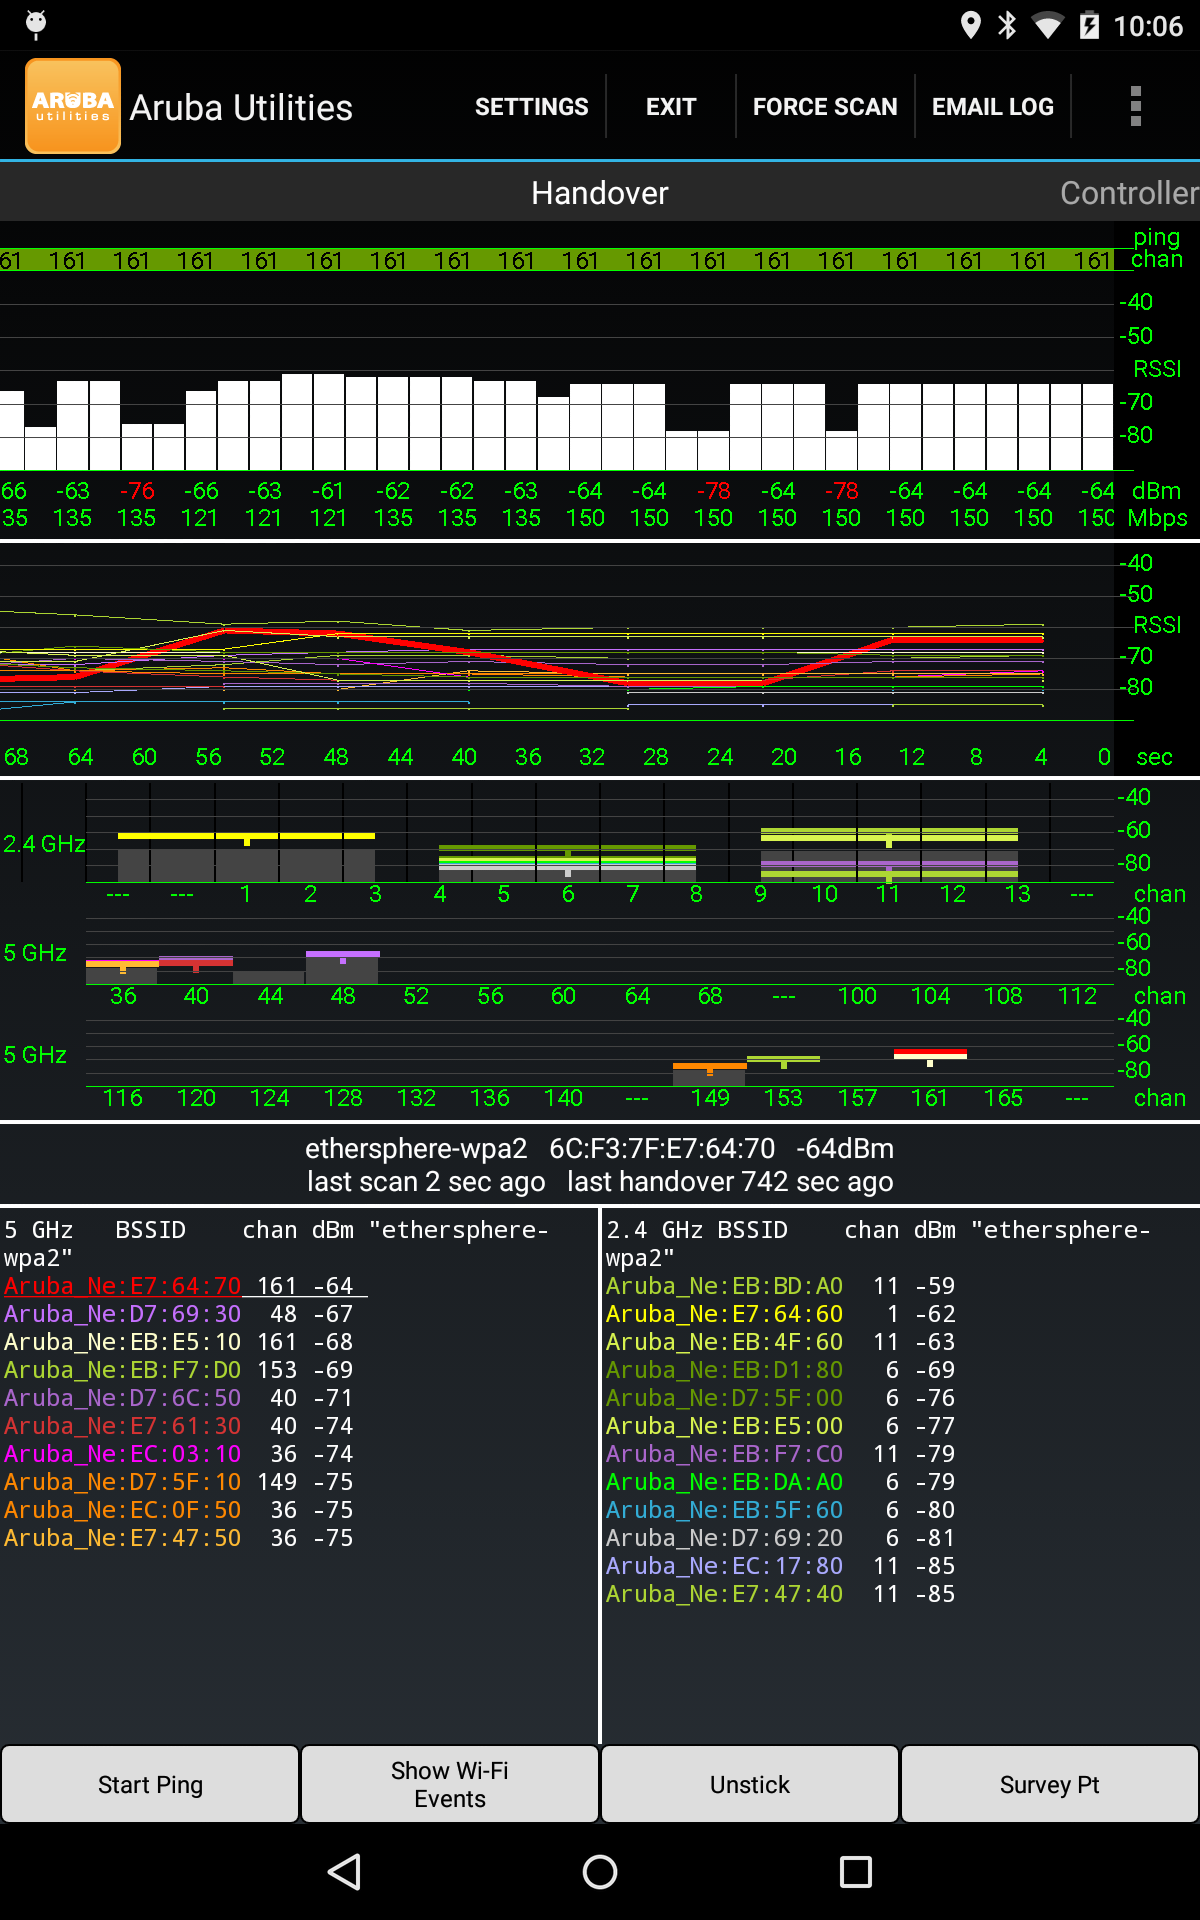
The Handover view aligns connection, scan and channel history so an AP change can be examined in context.
NUMBERED SCREEN REFERENCEMAR 2023
123456
The March 2023 app capture is shown within a simpler phone outline. Open original image ↗
Reading the Handover view
01
Connection view · channel ribbon
The ribbon records the currently connected channel, with the newest reading at the right. When ping is running, its results appear above the ribbon. A handover can show as a change in channel number or color; two APs on the same channel can hand over without that change.
02
Connection view · RSSI and link rate
The histogram shows RSSI for the current connection, with dBm and reported link rates below. A handover usually leaves a white “tooth” below the histogram; compare it with the channel ribbon, especially for same-channel handovers. The link rate is a PHY report, not measured application throughput.
03
Neighbor view
All audible BSSIDs are graphed on an RSSI scale as colored traces. Each color corresponds to the BSSID in the list below. The currently connected AP has a thick line, making it easy to see whether the device is connected to the AP with the strongest received signal.
04
Channel view
Colored shapes show BSSIDs advertising the currently connected SSID, with channel width drawn to scale and the primary channel marked. Gray shapes show other SSIDs: these may be co-channel, potentially interfering APs, or other SSIDs on the same AP. Their widths represent channel width and their vertical positions represent RSSI. The first screen covers 2.4 and 5 GHz; press 6 GHz for the second screen. Together they show the channel plan and signal strengths as seen by the device.
05
Current connection
The summary gives the SSID, BSSID, RSSI and age of the last scan. Android normally limits a foreground app to four scan requests in two minutes; if a request is declined, the only visible clue here may be flat lines in the neighbor view. Check scan age before interpreting those traces. See the scan timing note.
06
Scanned BSSIDs
Rows show AP identity, band/channel, width, dBm, security and SSID. The currently connected BSSID is underlined. Matching colors link a BSSID row, its RSSI trace and channel marking; BSSIDs on the same AP should share a color. AP names, OUI vendor labels, measured range and the tap-for-detail view are explained below.
COLOR KEY
BSSID row → RSSI trace → channel mark
The hue identifies the AP; the dBm value indicates received signal.
History and scale
The connection and neighbor views extend left from the latest reading for roughly ten minutes of history. Both views can also be expanded vertically to inspect their plots more closely.
ANNOTATION 06 · BSSID LIST
Reading an AP row
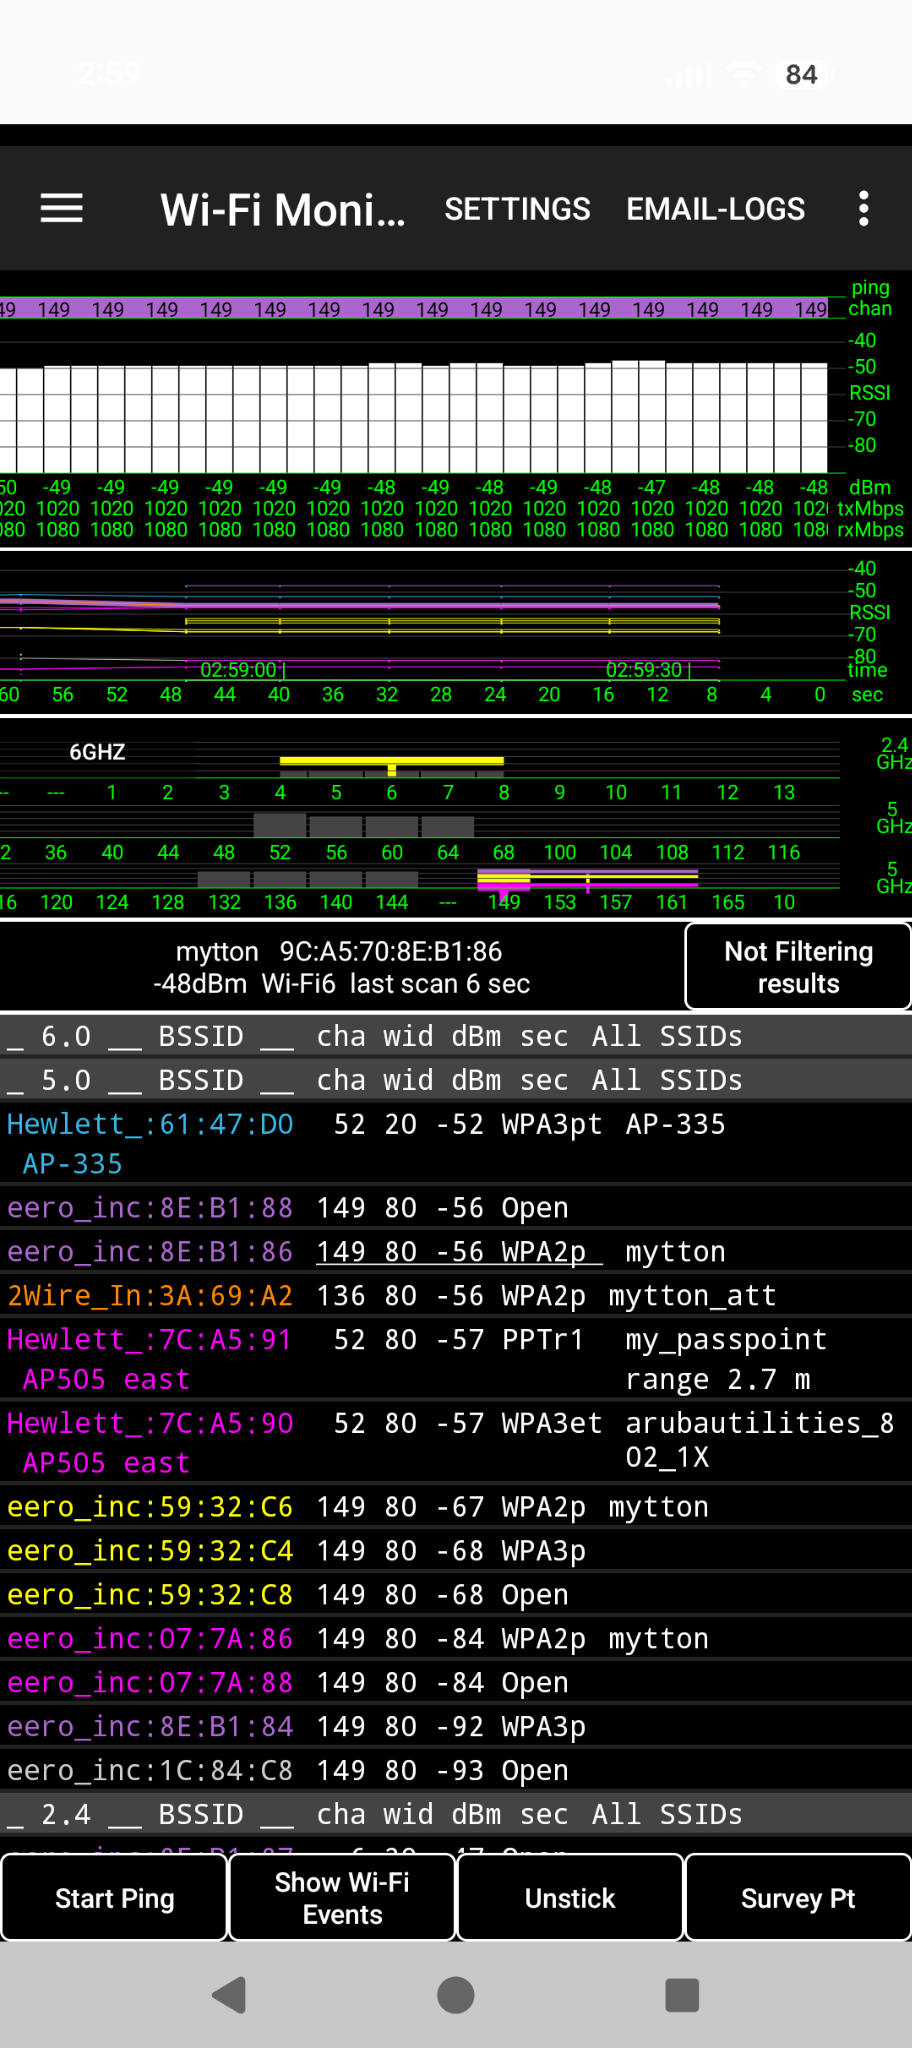
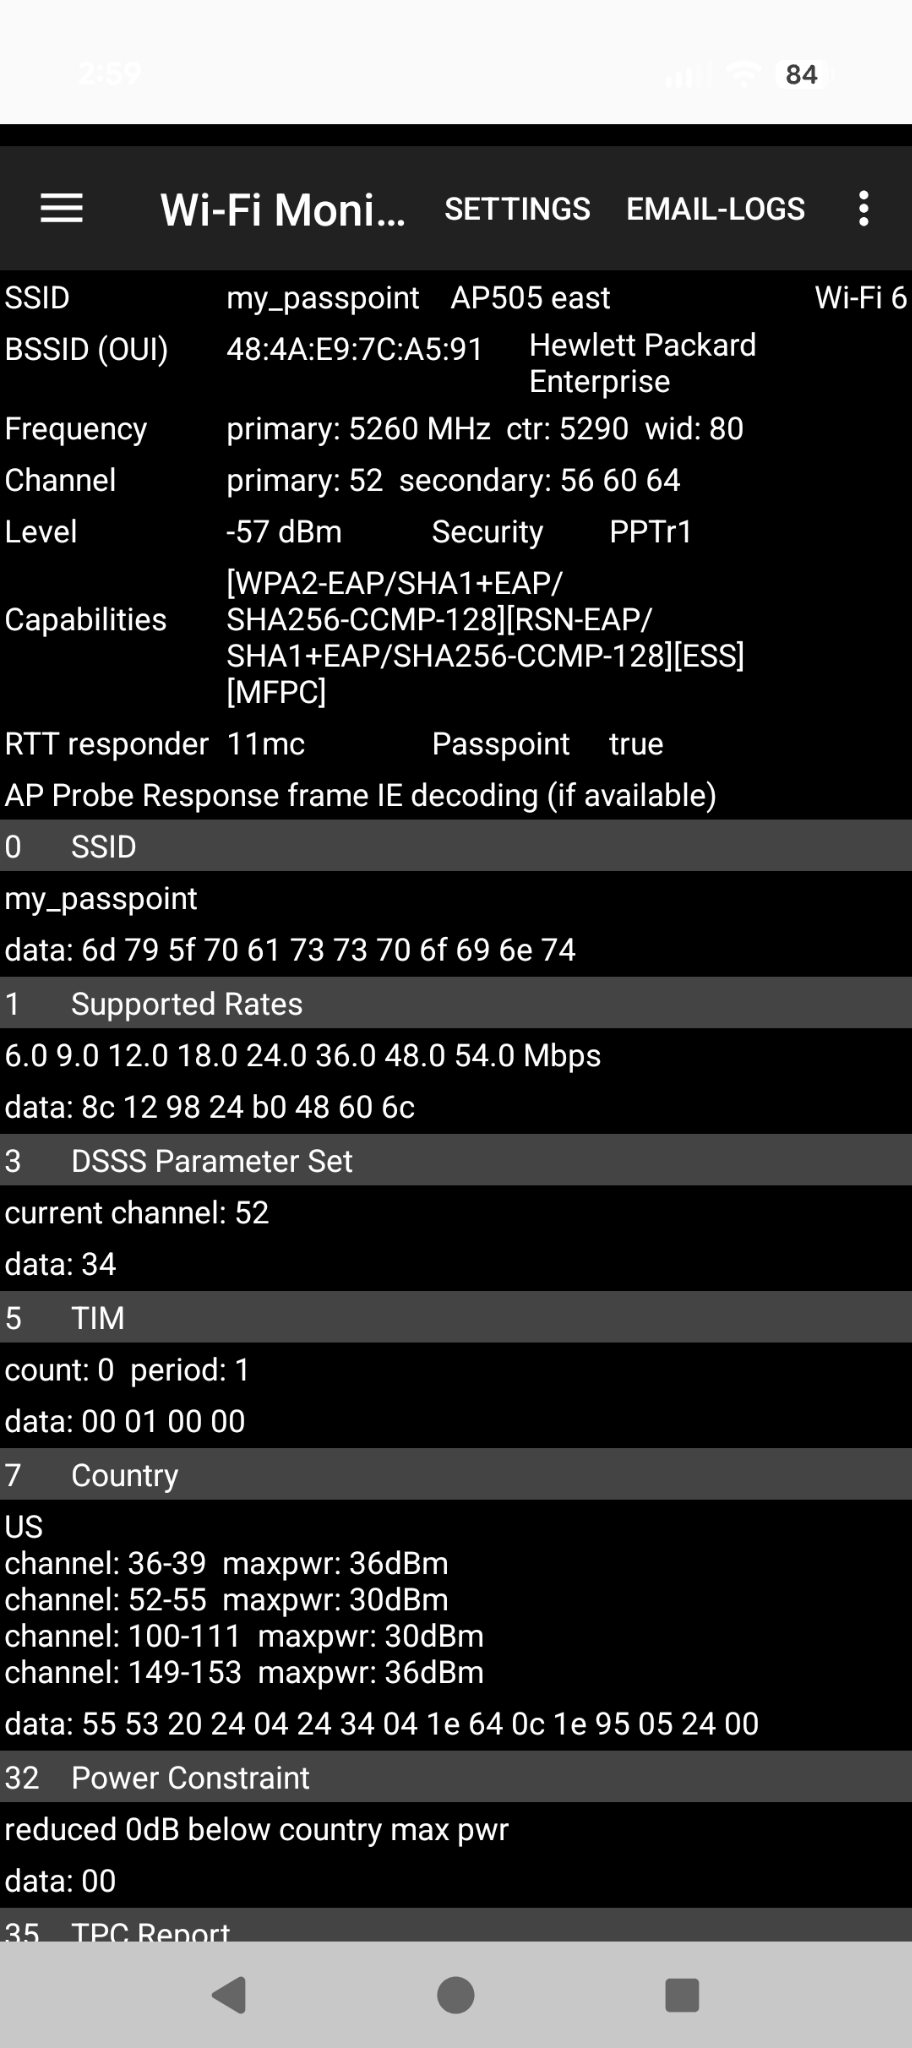
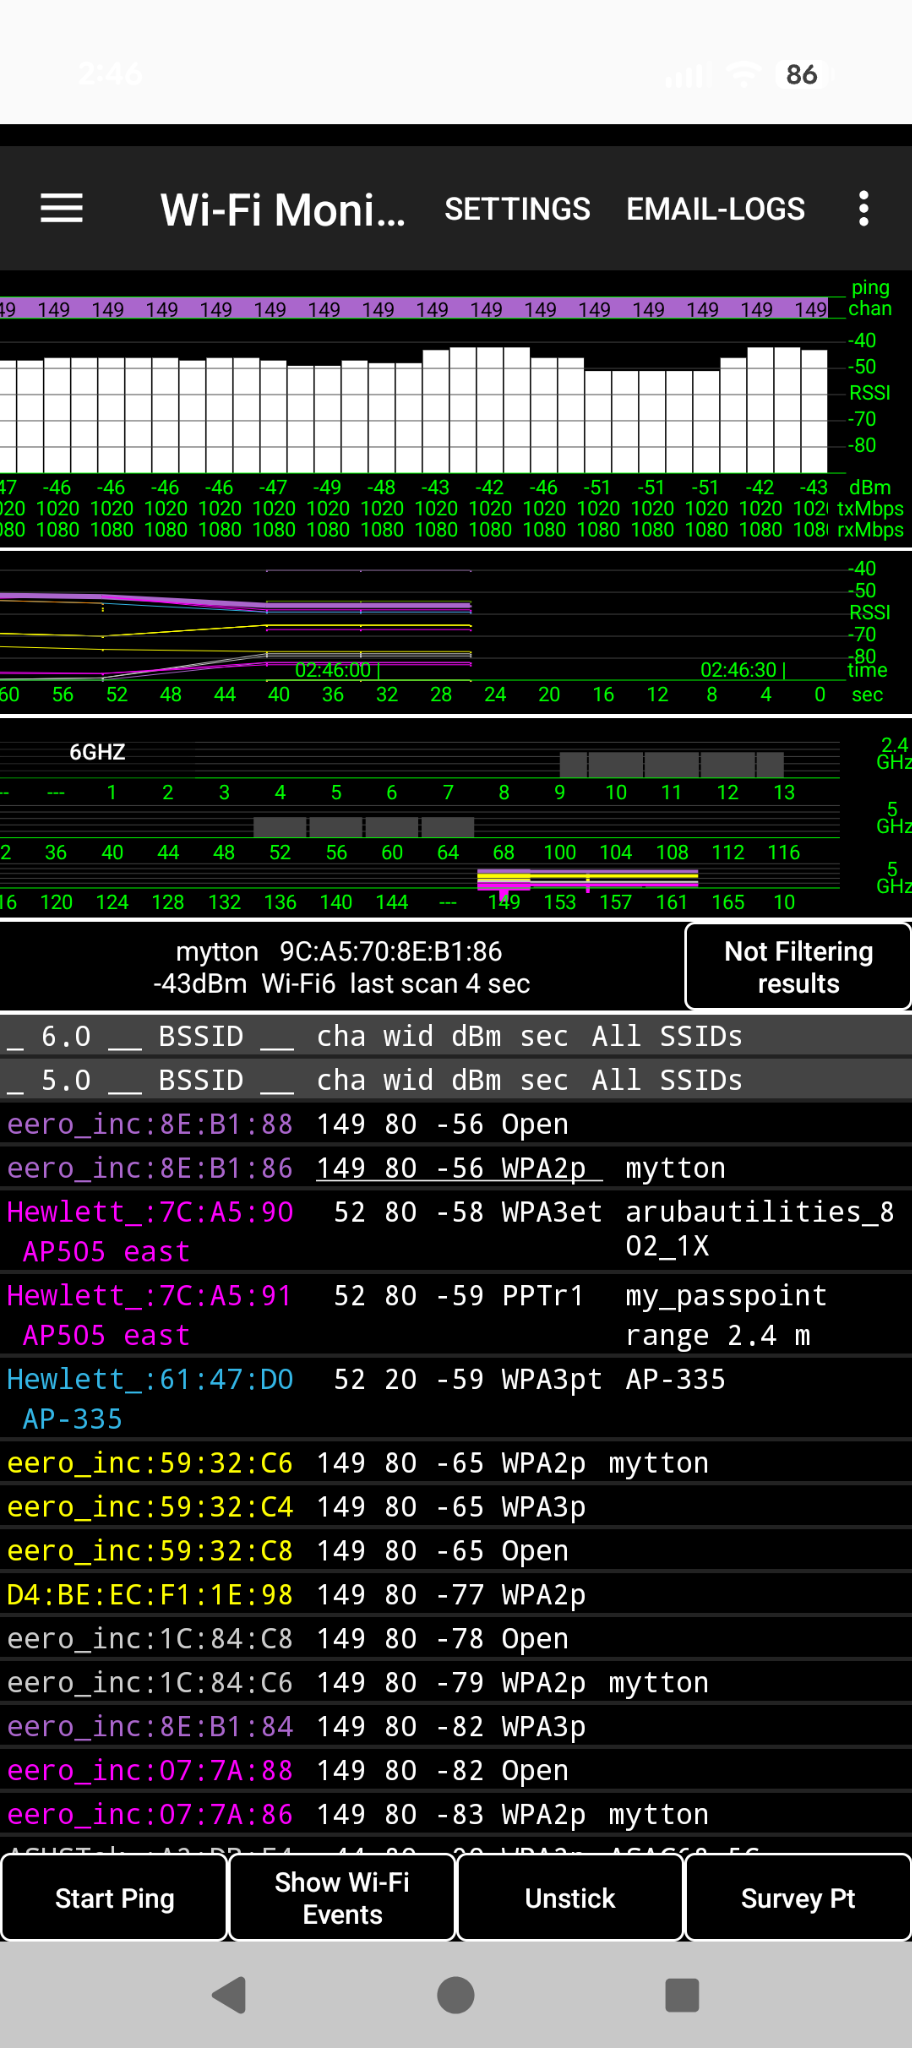
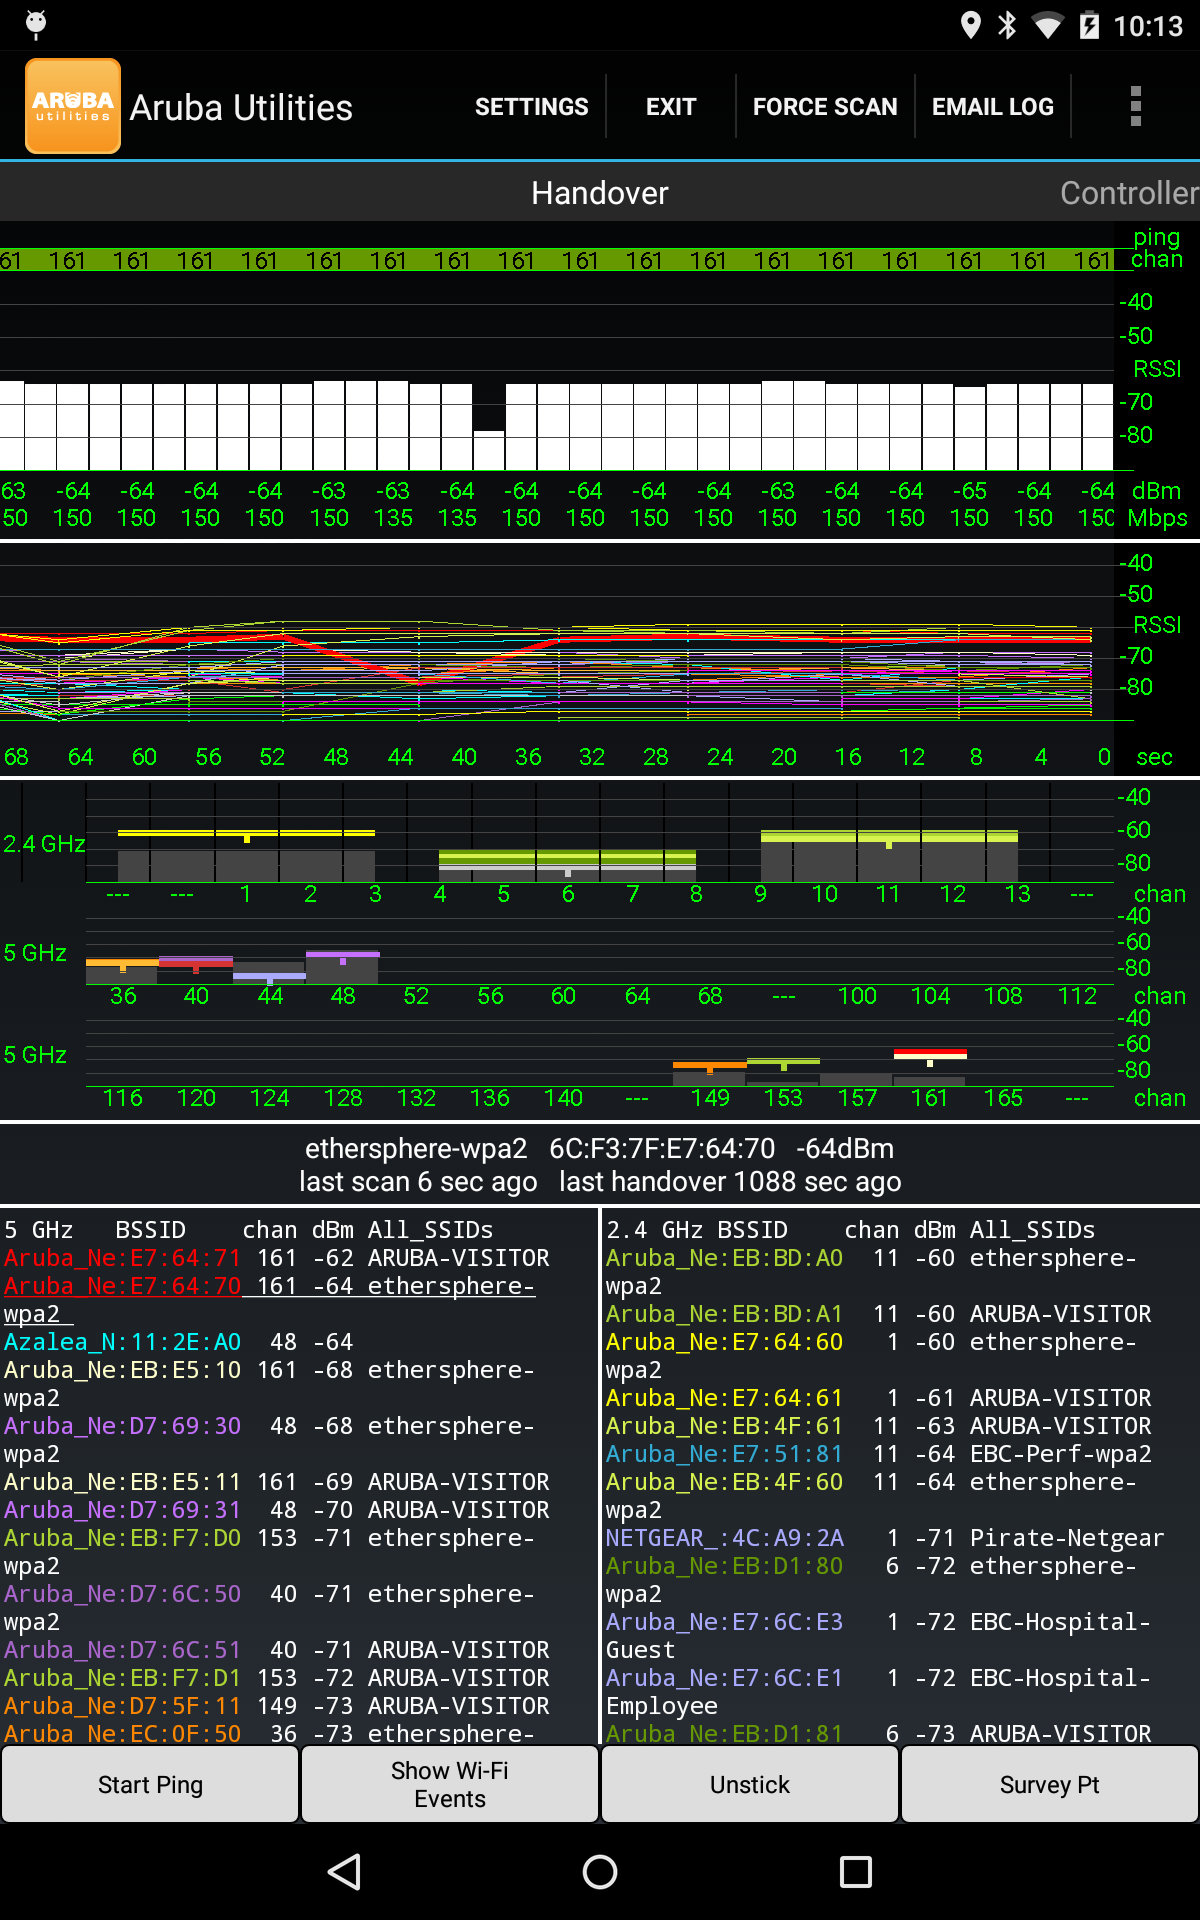
The September 2026 captures below show the additional information in a BSSID row and the detail screen opened from it.
AP name. If an Aruba or Mist AP advertises an AP name, it is shown under the BSSID at the left of the row.
Vendor prefix. When the first six hex digits of a BSSID match an entry in the IEEE MA-L (OUI) table, the app substitutes the vendor name for that prefix. Its local copy of the table is refreshed approximately every six months.
Measured range. An AP configured as an FTM responder for 802.11mc or 802.11az ranging can show the measured range on the right, as in the “range 2.7 m” row here.
Touching a BSSID row opens more information about that AP. The example shows the full BSSID and OUI vendor, frequency and channel details, signal level, security capabilities and RTT responder status. Where available, the app also decodes information elements from the latest probe response. The exact fields depend on what Android reports for the AP.
CONTROLS AND SETTINGS
What the buttons do
The button label Start Ping on this screen differs from the separate Ping tab below.
Start Ping
Tests the current default gateway IP address every two seconds. Green means a response within one second; yellow means one to two seconds; red means longer than two seconds. Read a change alongside the RSSI and channel history. This tests the first network hop, not an arbitrary internet host.
Show Wi-Fi Events
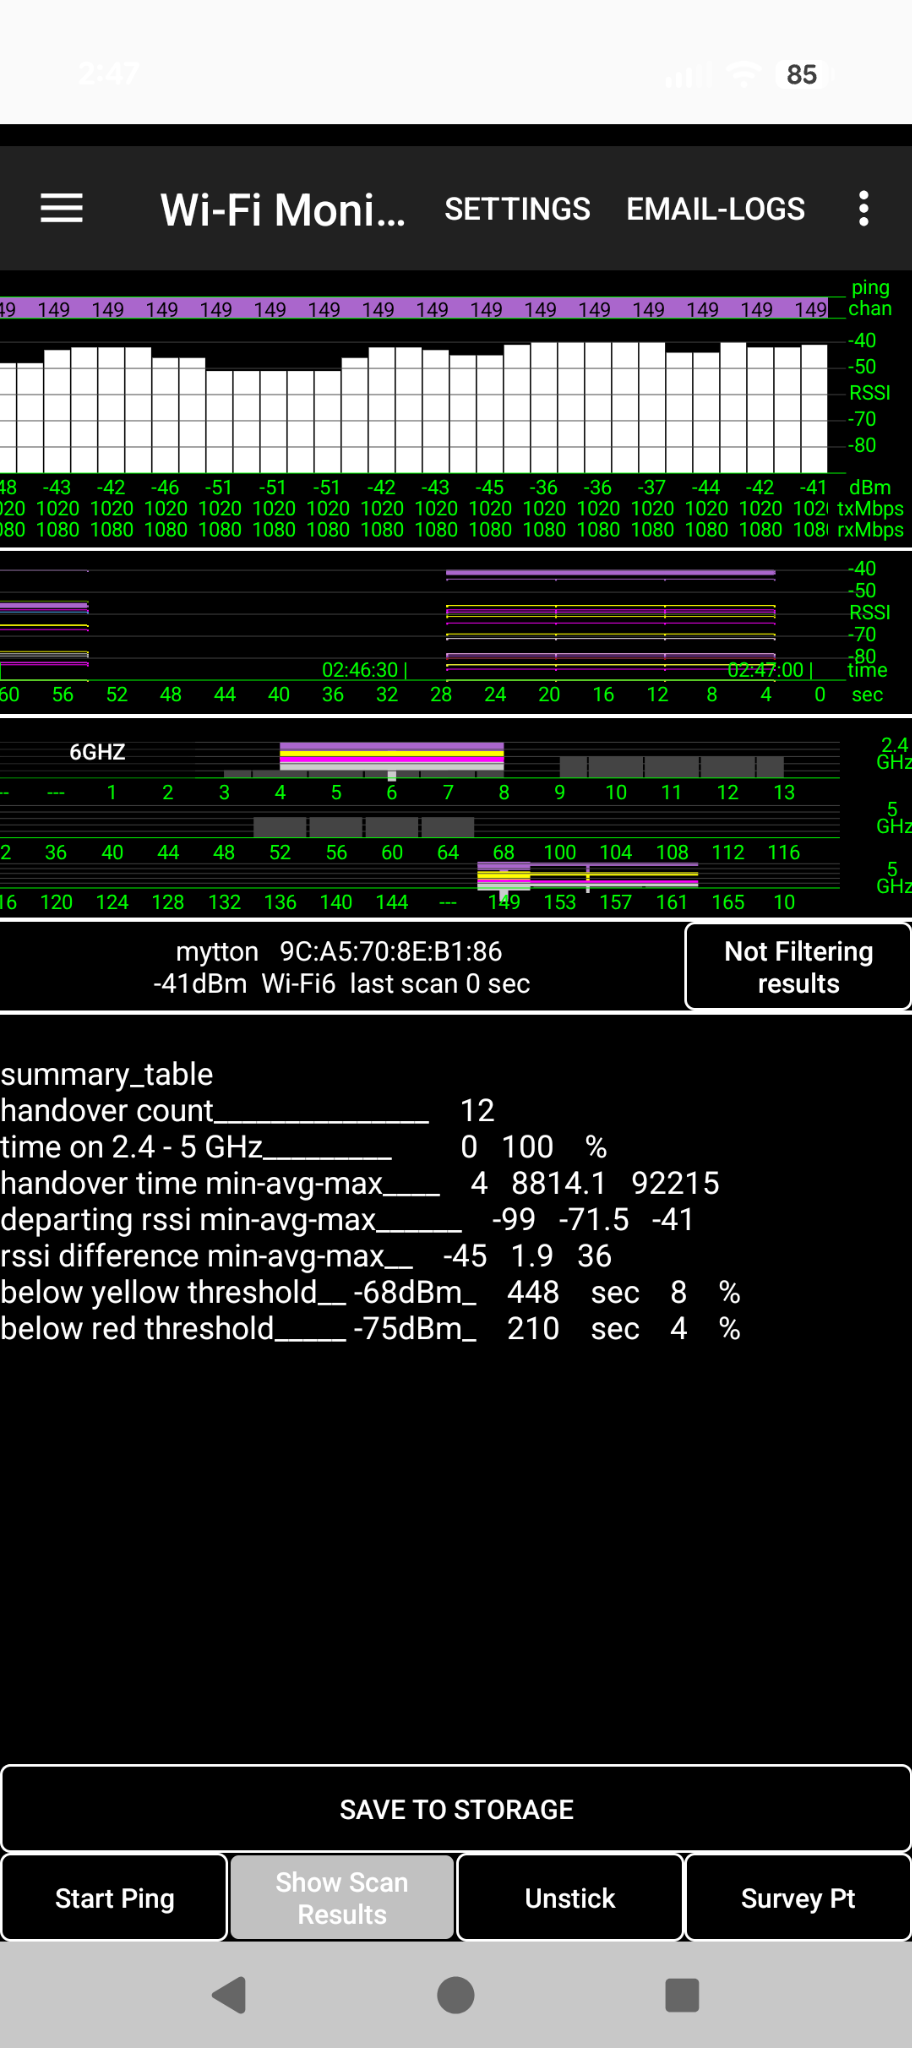
This button cycles the lower pane through scan results → Wi-Fi events → handover summary → scan results. The button text names the view that the next press will show. The three views are illustrated below.
Unstick
Sends a reassociate command to Android’s Wi-Fi manager to ask the phone to reconsider its AP. A stronger candidate must be available, and the phone controls the eventual association. The Android OS frequently ignores this command.
Survey Pt
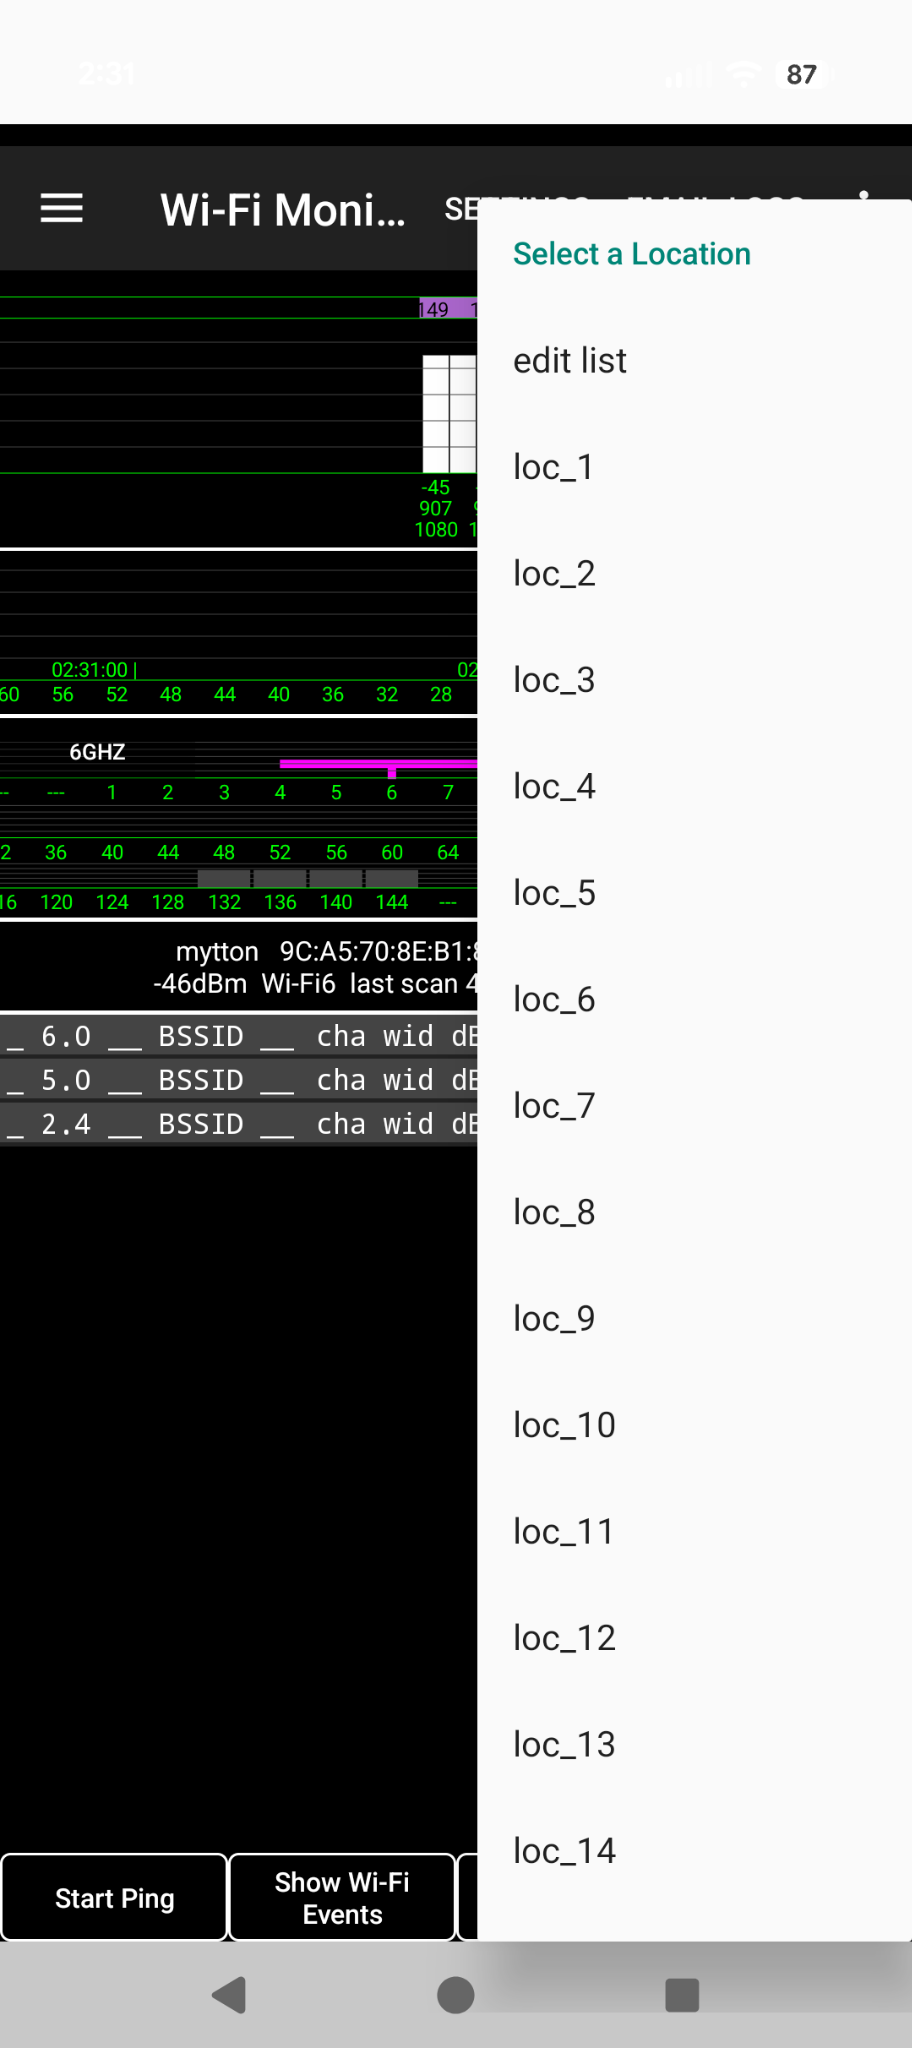
Long-press to open the location list, select a point, or choose edit list to customize it. At each named point, press Survey Pt to record the current signal measurements. The CSV is included in the Email Logs attachment bundle.
WI-FI MONITOR · THREE VIEWS
Scan results, events and handover summary
The connection and radio plots stay above the changing lower pane. Read the button as an instruction for the next view.
The lower pane lists scanned APs with BSSID, channel, width, signal, security and SSID. This is the normal view described above. Its button reads Show Wi-Fi Events; press it to see the event log.
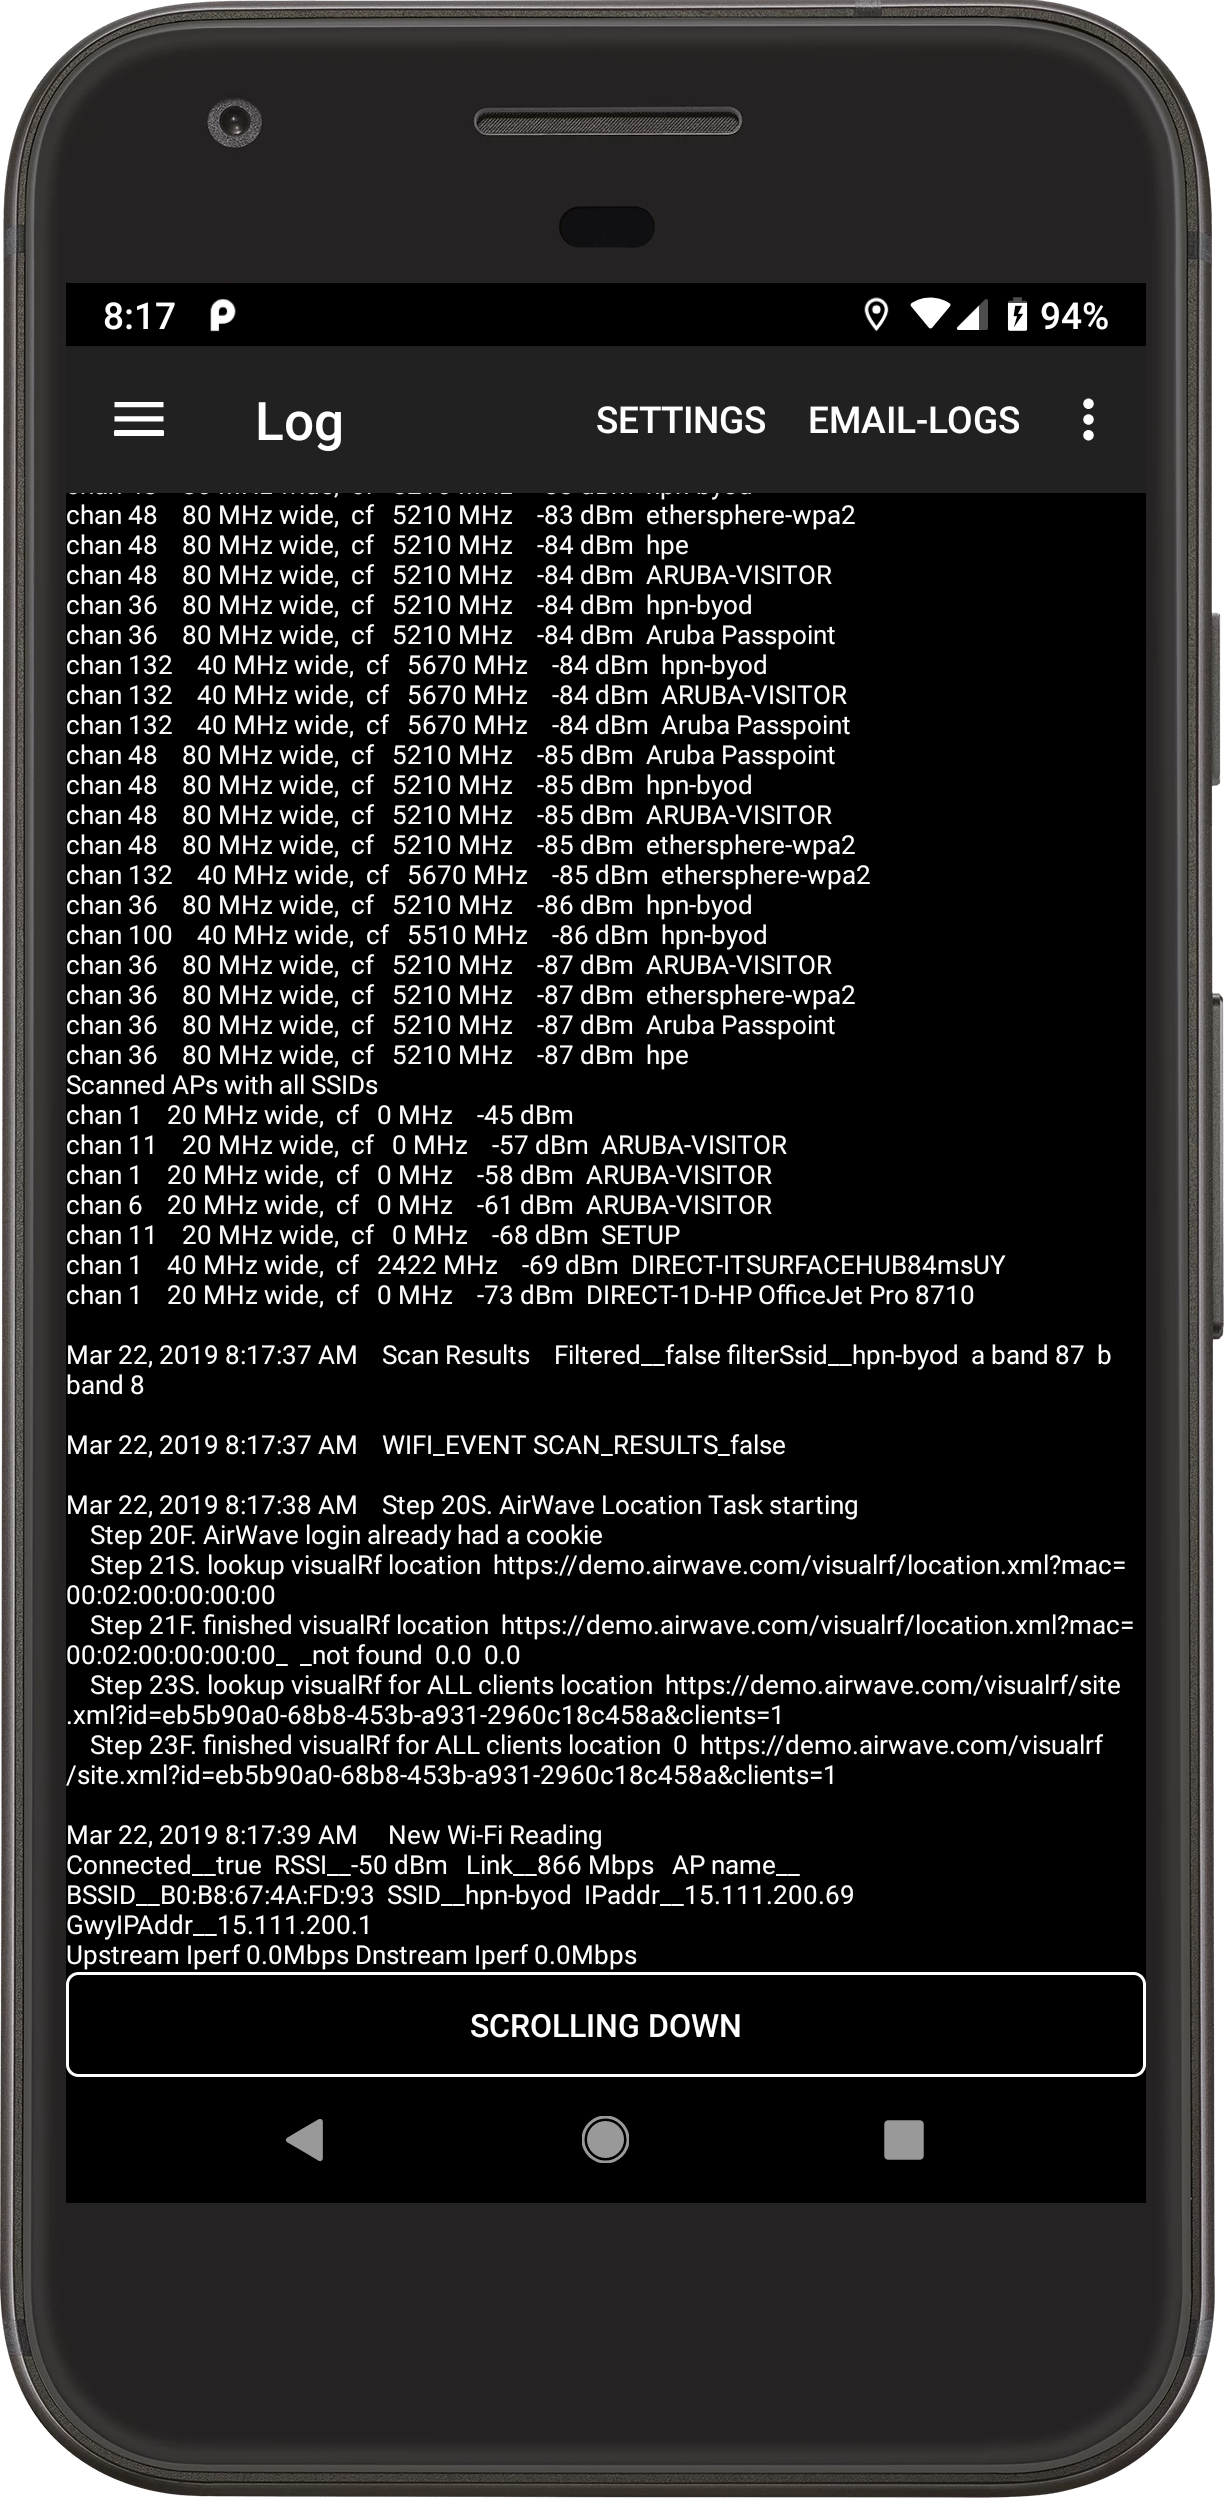
The BSSID list is replaced by messages reported by the device, including wpa_supplicant and scan events. Use timestamps to relate association or state changes to the plots. The button now reads Show Handovers; press it for the summary.
The cumulative summary includes handover count, time on each band, handover outage time, departing RSSI, RSSI difference, and time below the yellow and red signal thresholds. Save to Storage writes the per-handover raw data as a CSV, which is included in the Email Logs attachment bundle. The bottom toggle reads Show Scan Results; press it to return to the BSSID list.
An actual handover CSV export can be added later to show its field names and individual records.
SURVEY PT · CURRENT EXAMPLE
A repeatable walkaround survey
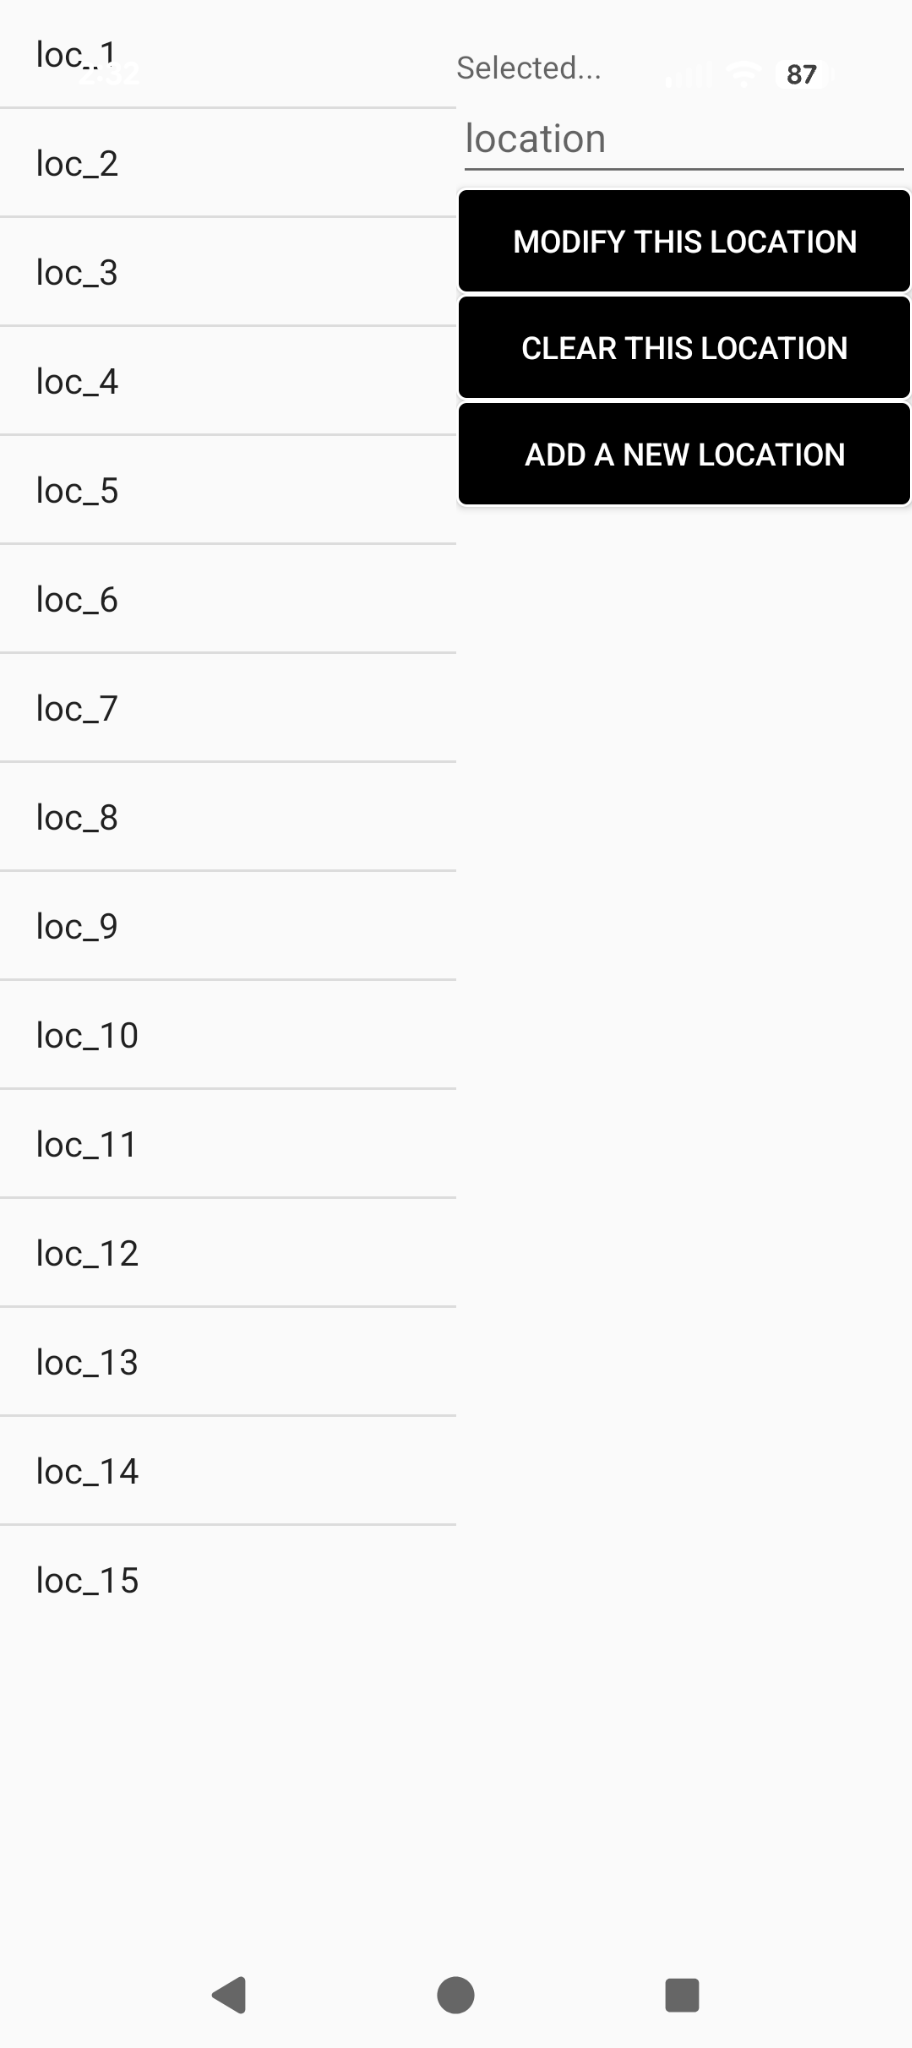
Long-press Survey Pt to choose a named location. Select edit list to modify, clear or add locations.
Walk the same route on your floor for each survey run. Press Survey Pt at the same named places every time.
Use Email Logs to prepare the attachment bundle. The survey CSV tabulates signal strength values at the points so separate runs can be compared.
A real example CSV can be added when one is available; the export’s columns are not reproduced here from memory.
01 · Choose a locationLong-press opens the saved locations and edit list.Open full screenshot ↗
02 · Customize the listModify, clear or add the named survey locations.Open full screenshot ↗
Filter and color settings
Filter Scan Results limits the scanned AP display to the current SSID; it does not change the network to which Android is connected. Forced Scan Interval sets scan timing, subject to Android limits. Yellow / Red Thresholds set when RSSI and dBm numbers change color; those threshold colors are separate from the AP identity hues.
FILTER EXAMPLE · 2015
SSID filter and BSSID list
The same historical Handover screen shows the practical effect of an SSID filter in its BSSID table. The images below are cropped to the lower part of the screen, where the result is easiest to see.
01 / CONFIGURATION EXAMPLE
Filter Scan ResultsOn
SSID in this exampleethersphere-wpa2
This is an illustrative setting, not a capture of the Settings screen. The supplied material has no settings screenshot. The exact SSID is visible in the paired 2015 capture; a current Settings screenshot will replace this example.
With filtering enabled, the list headings name ethersphere-wpa2 and the rows show matching BSSIDs. With filtering off, the list also names other nearby SSIDs. A current configuration capture can show the exact input and wildcard syntax without relying on an approximation.
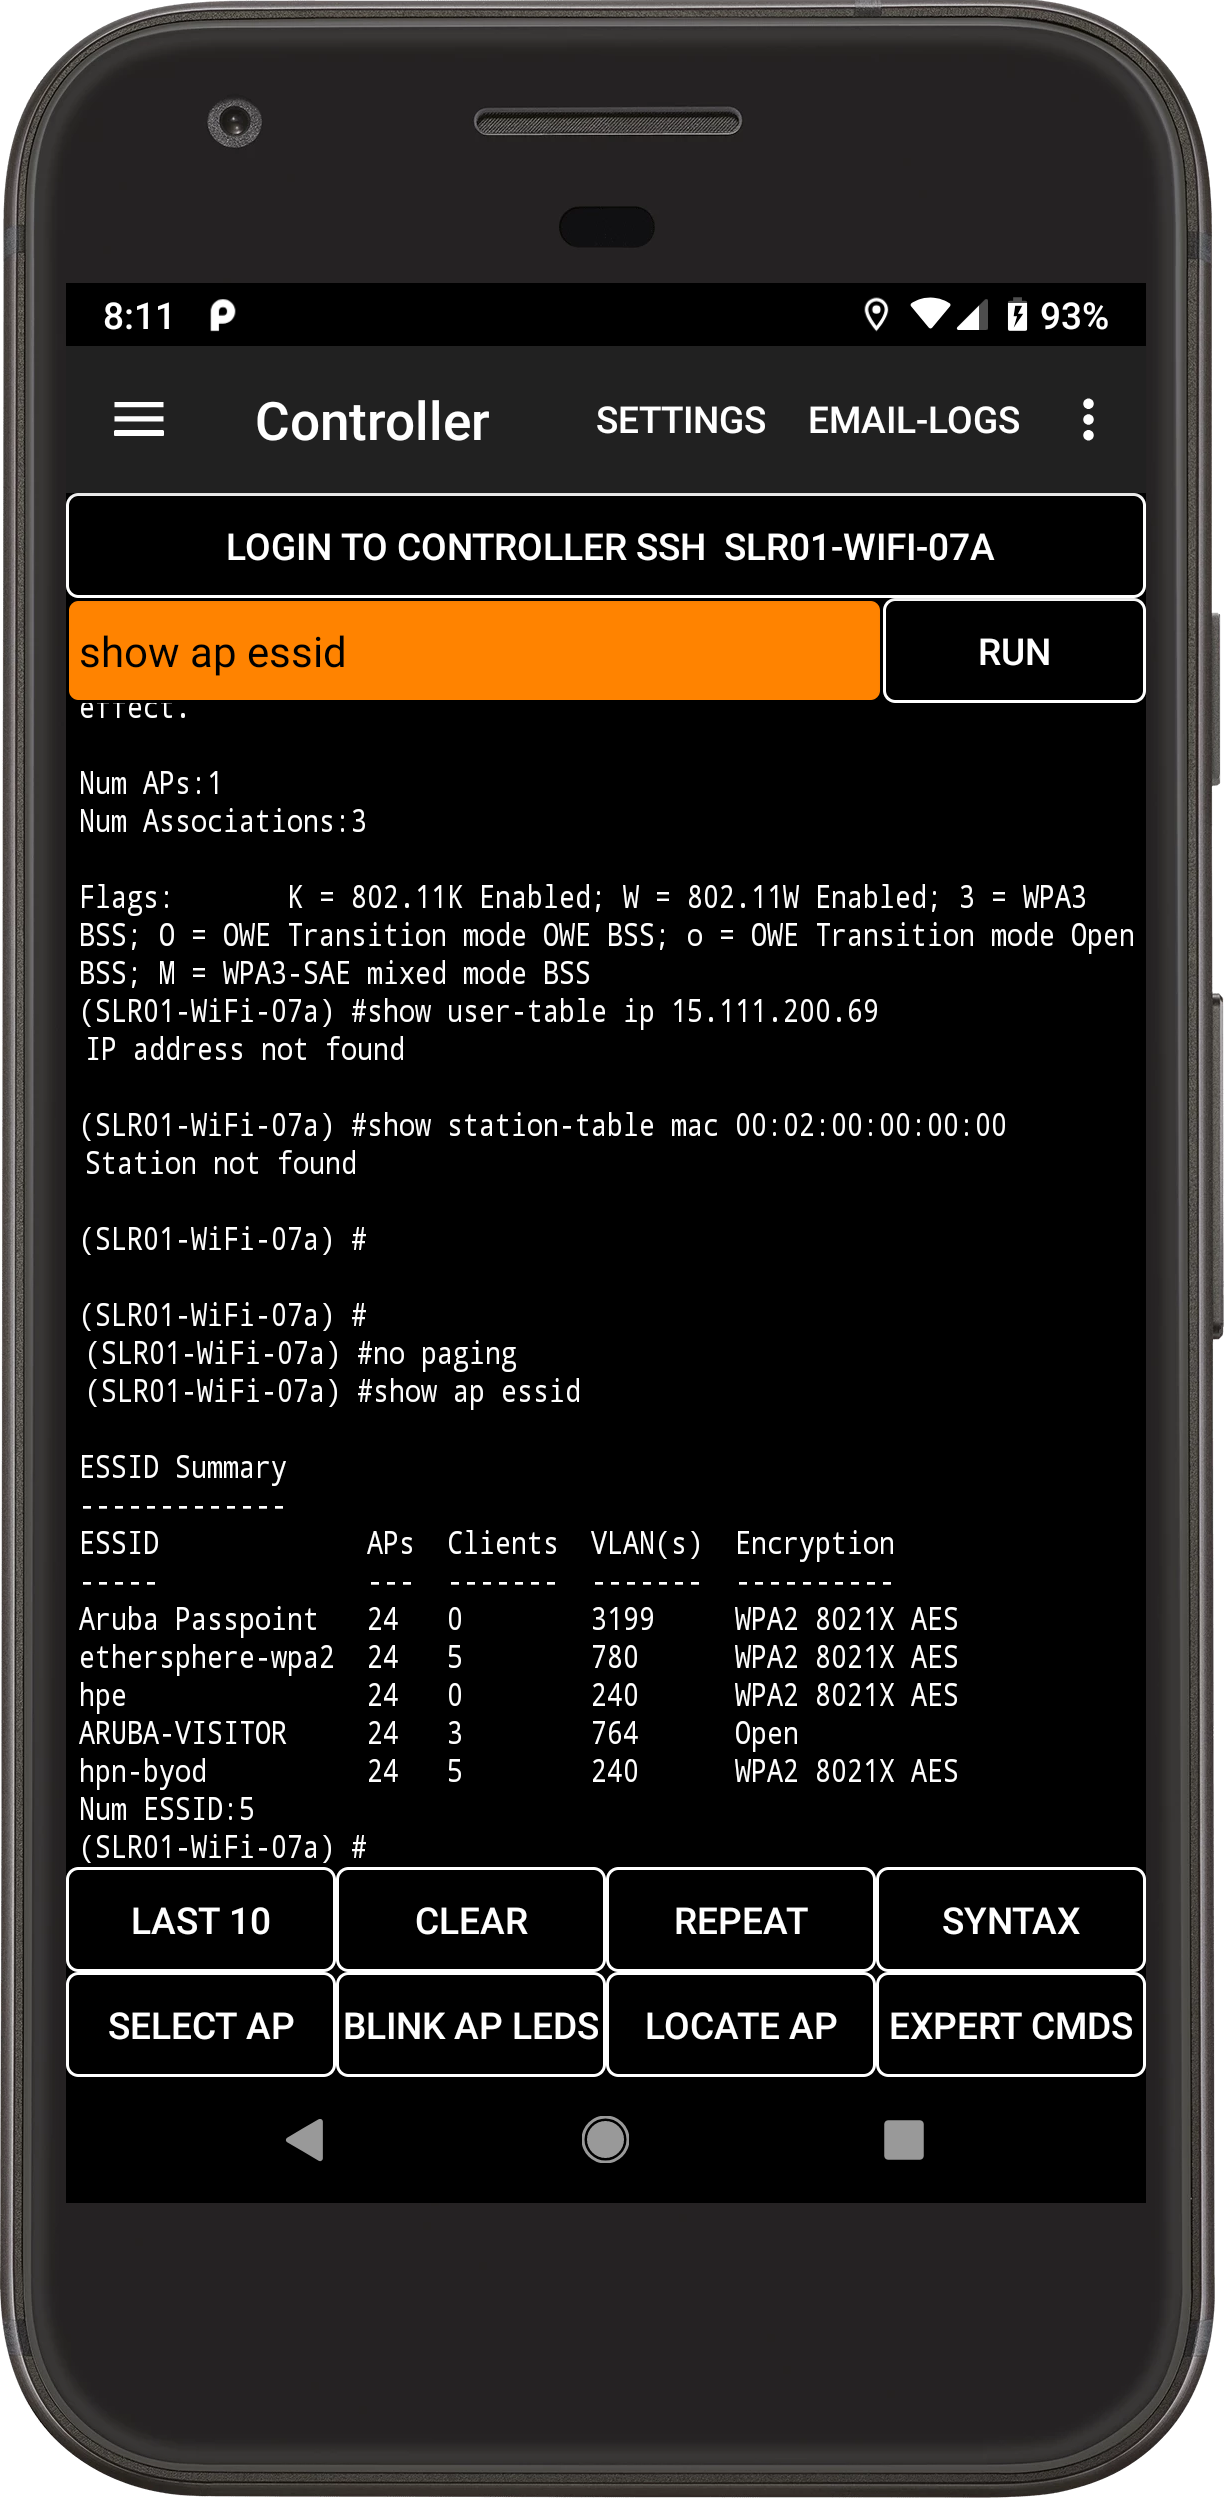
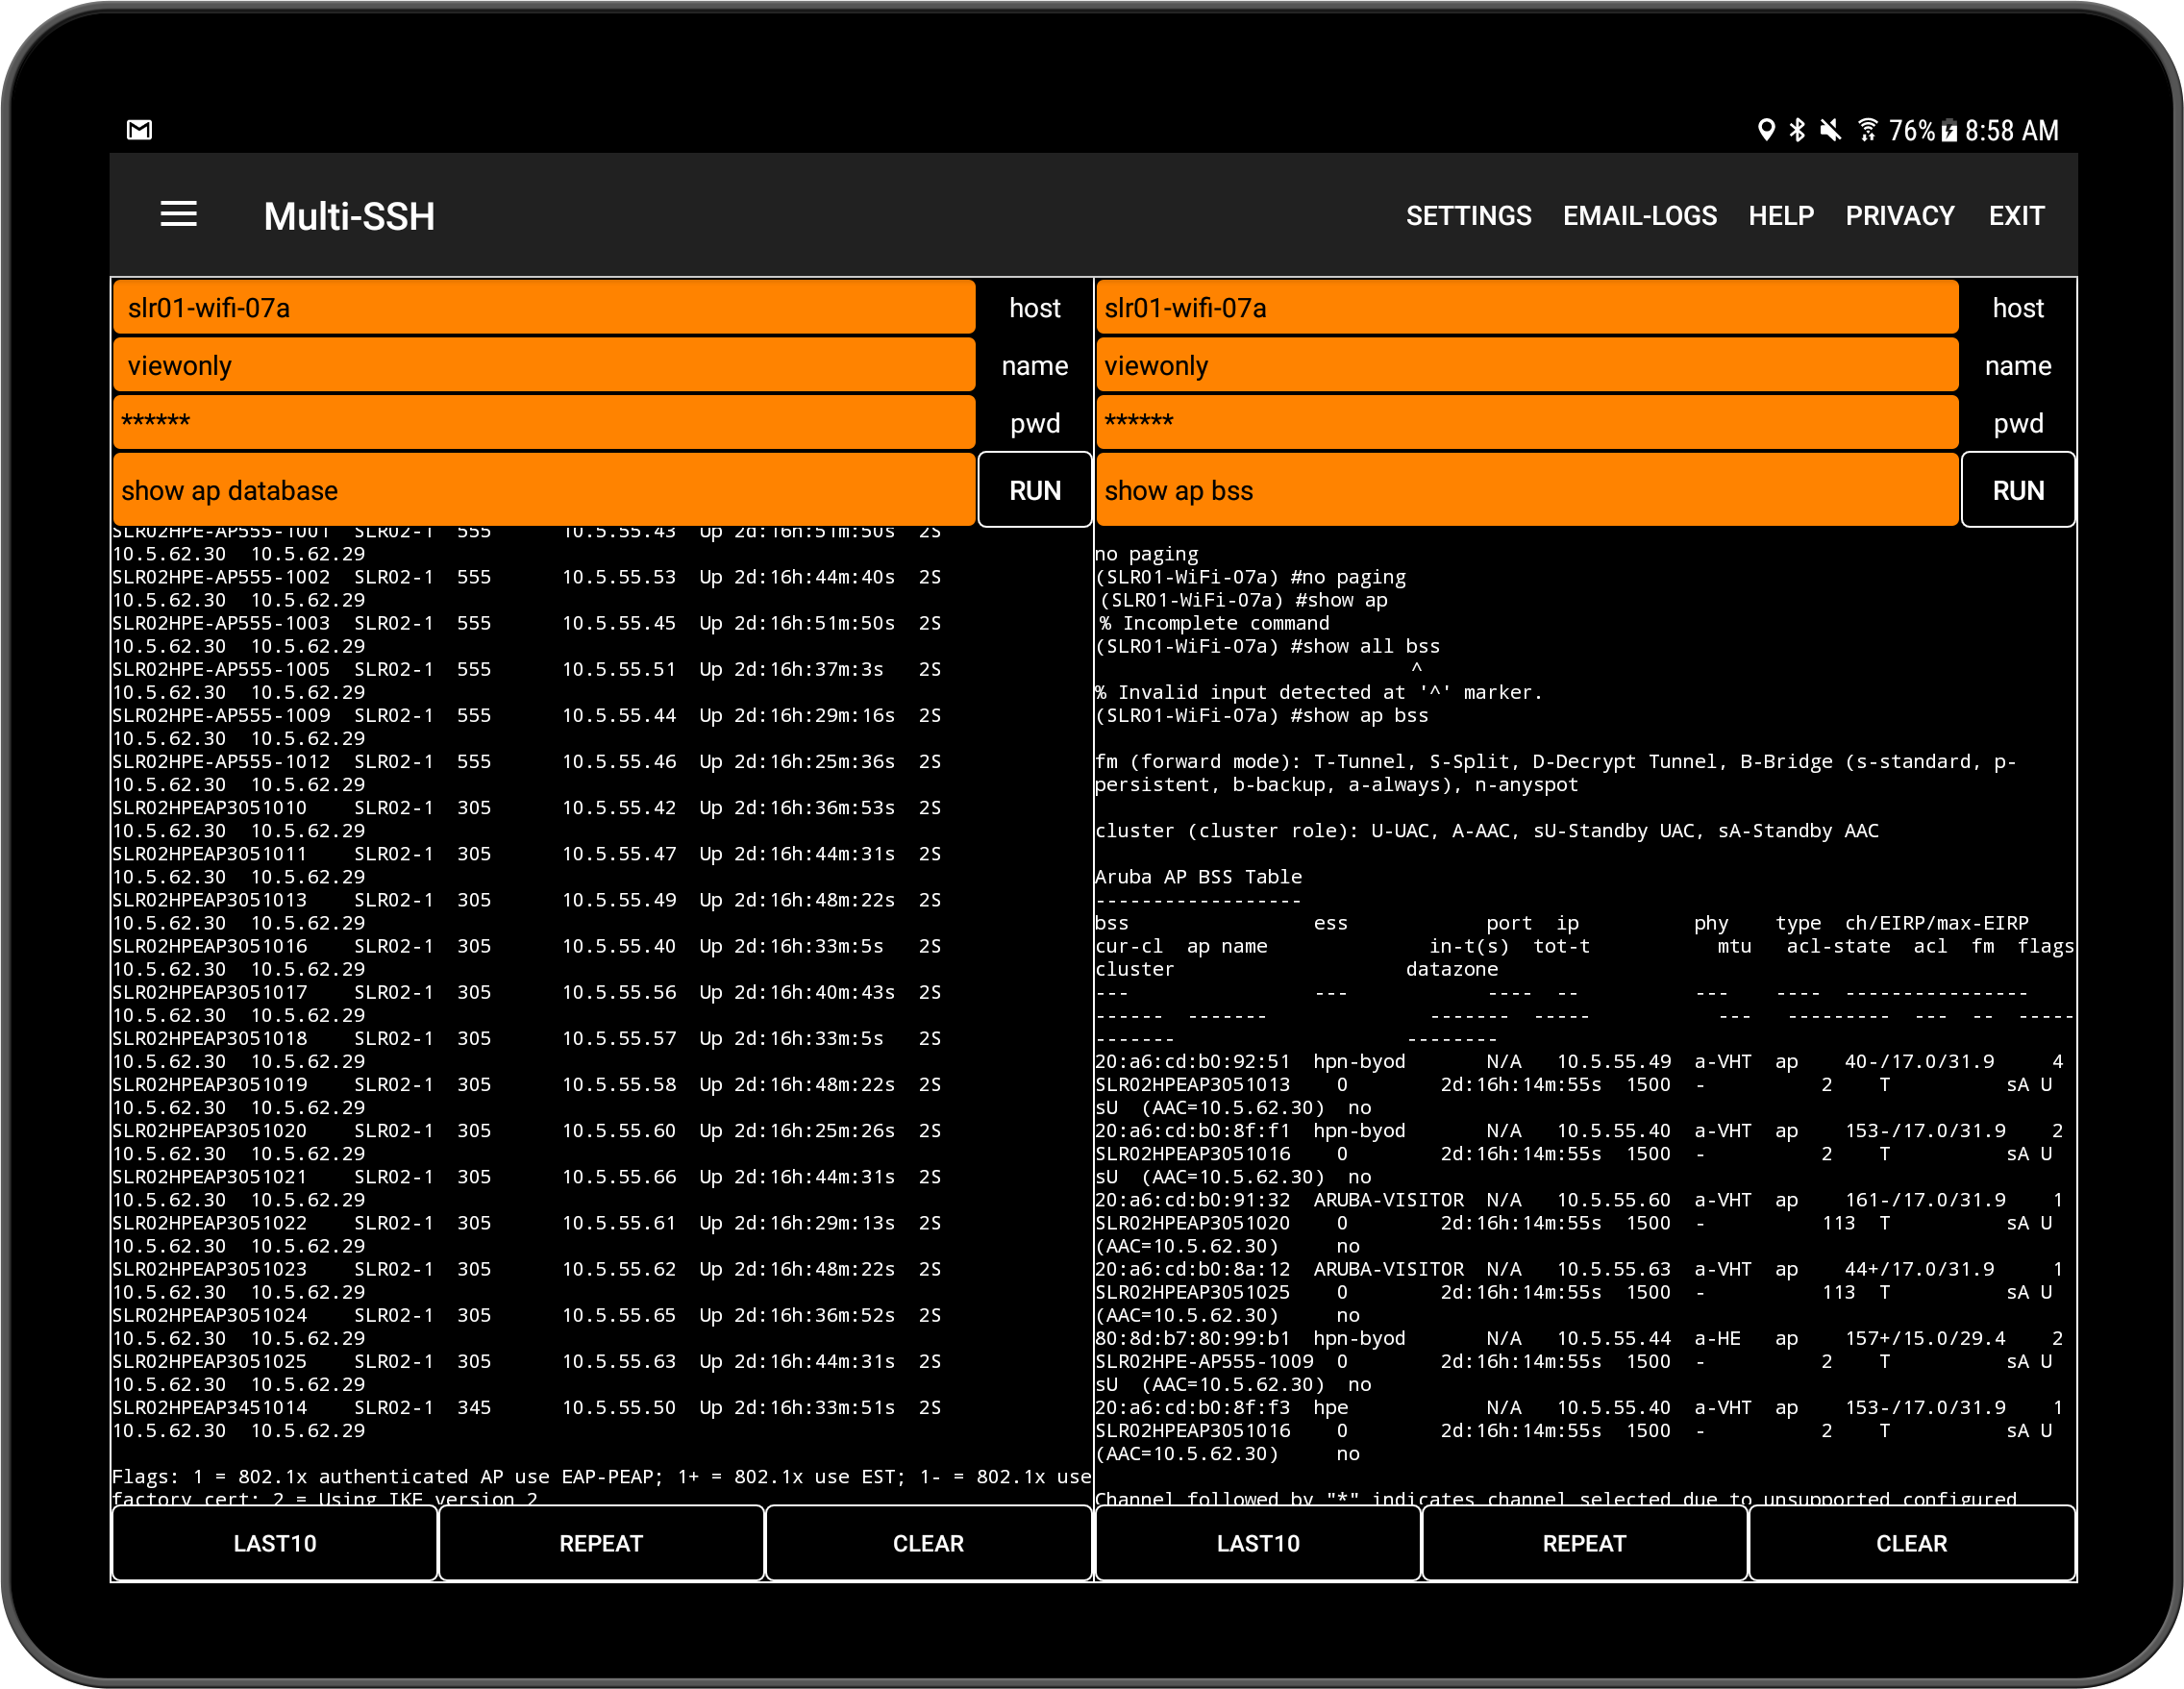
Enable controller login in Settings, enter the controller address and credentials, and choose SSH or Telnet. Login starts a terminal session and attempts a show ap bss-table command.
02
Commands
Type a command and select Run Cmd. Long-press the history control for recent and useful commands; Run For Ever repeats a command at the interval set by a long press.
03
AP operations
Long-press Select AP to choose an access point for actions such as Blink AP LEDs. A successful controller lookup can add AP names to the Wi-Fi Monitor scan list.
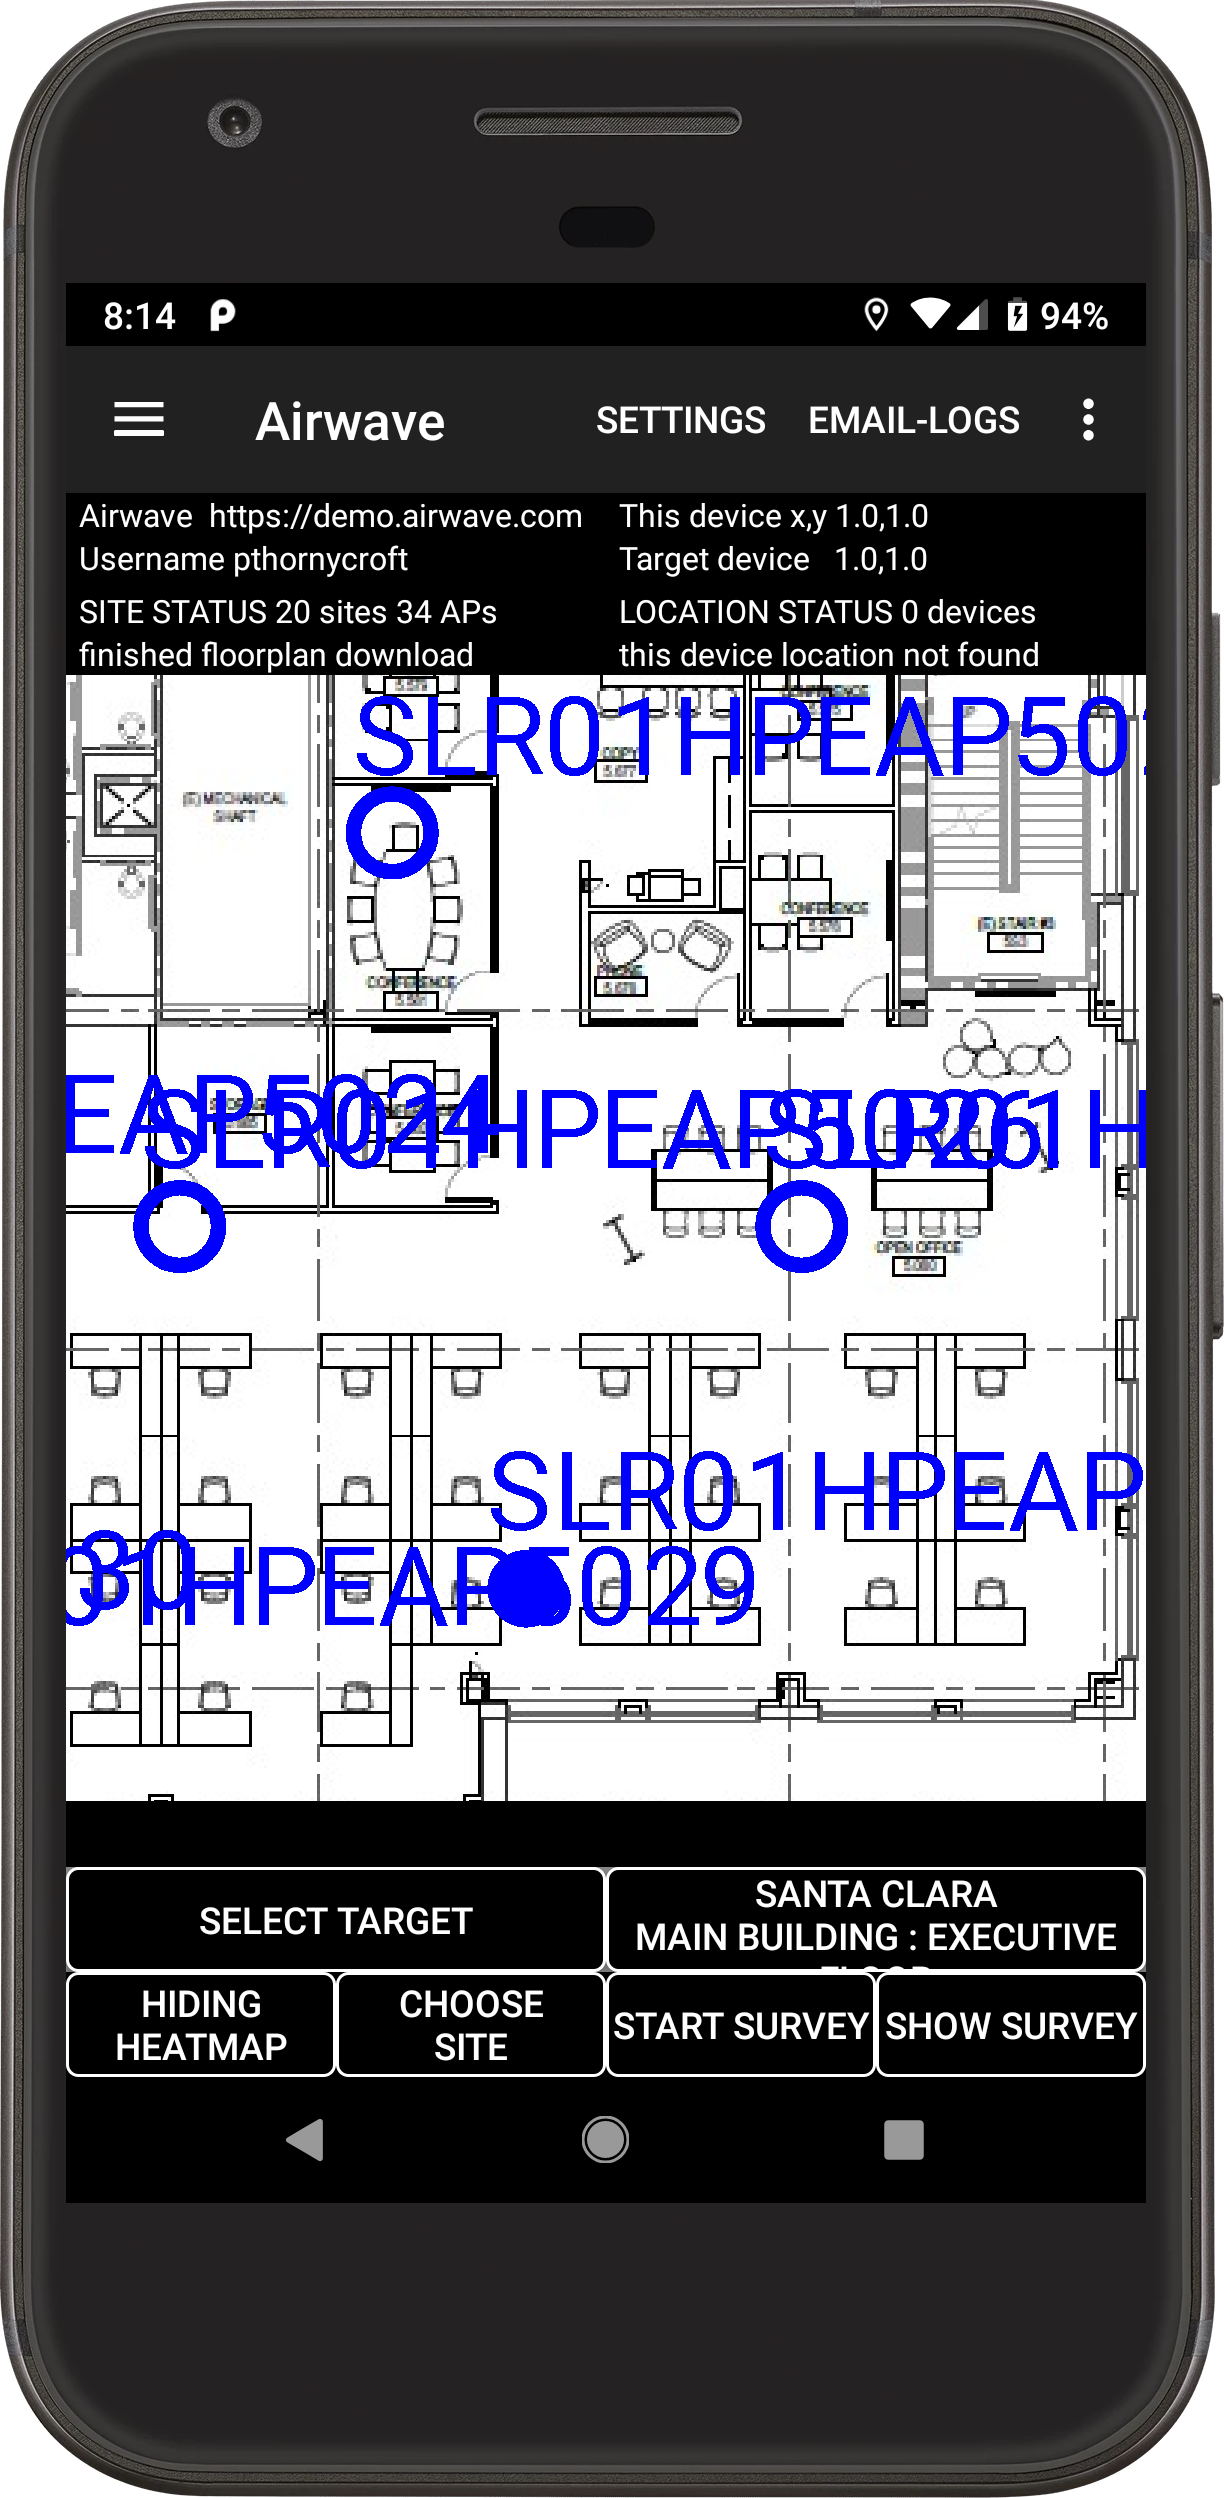
Enable AirWave access and enter the AirWave server address and credentials in Settings. Select Site downloads its floorplan and AP information; a cached floorplan can help with an offline survey.
02
Read the overlay
APs appear as blue circles; a solid blue AP is currently detected by the phone, and the connected AP appears red. The position and other overlays depend on the AirWave data and selected settings.
03
Record a survey
Start Survey, then touch the corresponding point on the floorplan to associate a scan snapshot with that location. Show Survey Results displays the current survey; Email Log can attach the survey file and annotated floorplan.
04 / APP SCREEN
Central
Central API queries and AP lookup
SCREEN CAPTURE PENDINGHELP TEXT
▣CentralScreen capture to be added
A current screenshot has not been supplied for this screen. The notes are based on the app’s Help.java text.
What to look for
01
Configure API access
In Central, create an app/token under Maintenance → API Gateway → System Apps & Tokens. In this tab's Config menu, enter the API gateway host (apigw, not app), account credentials, customer ID, client ID and client secret.
02
Run a query
Use Login to obtain an OAuth token. Select a saved REST path or enter one in the orange field; long-press the method control to choose GET, POST or DELETE, then run the request. The response area shows returned JSON.
03
AP association
List BSSIDs can populate AP names in Wi-Fi Monitor and the Central Select AP list. Locate AP follows scan RSSI, whose freshness still depends on Android scan timing. The tab cannot construct a JSON body for a POST request.
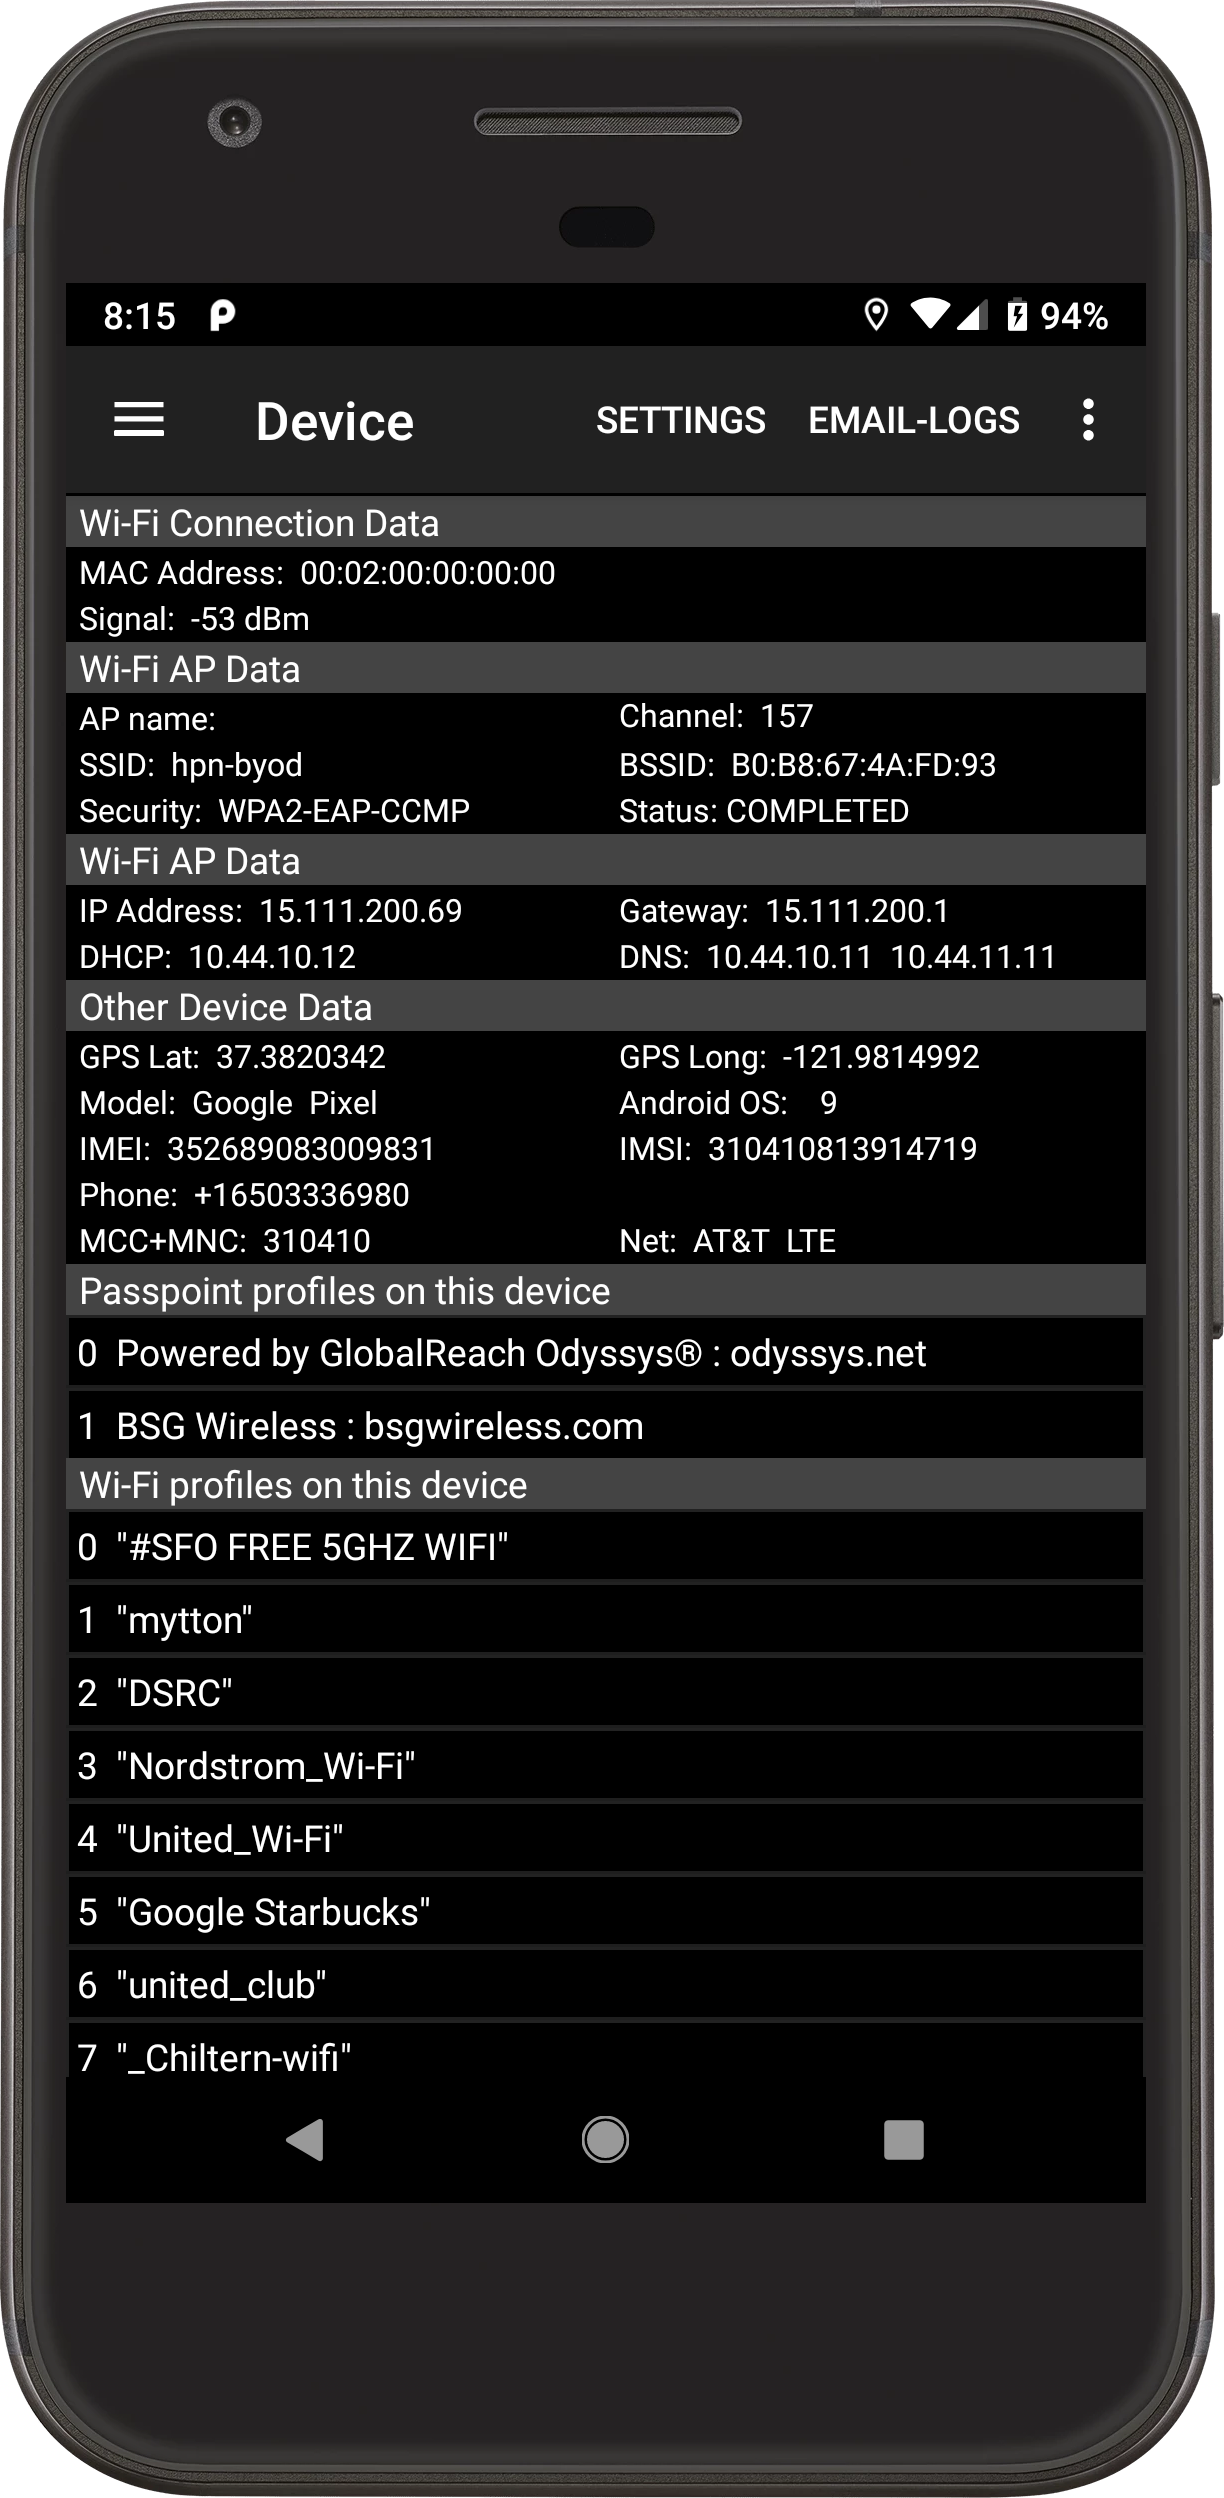
This screen displays network configuration and other data reported by Android on the device. Values and identifiers depend on hardware, permissions and Android release.
02
Saved profiles
Open the Wi-Fi configuration and Passpoint profile lists for their own detail screens when supported by the Android version.
03
Interpretation
These values describe the phone's view of its configuration; compare them with the WLAN infrastructure when diagnosing a mismatch.
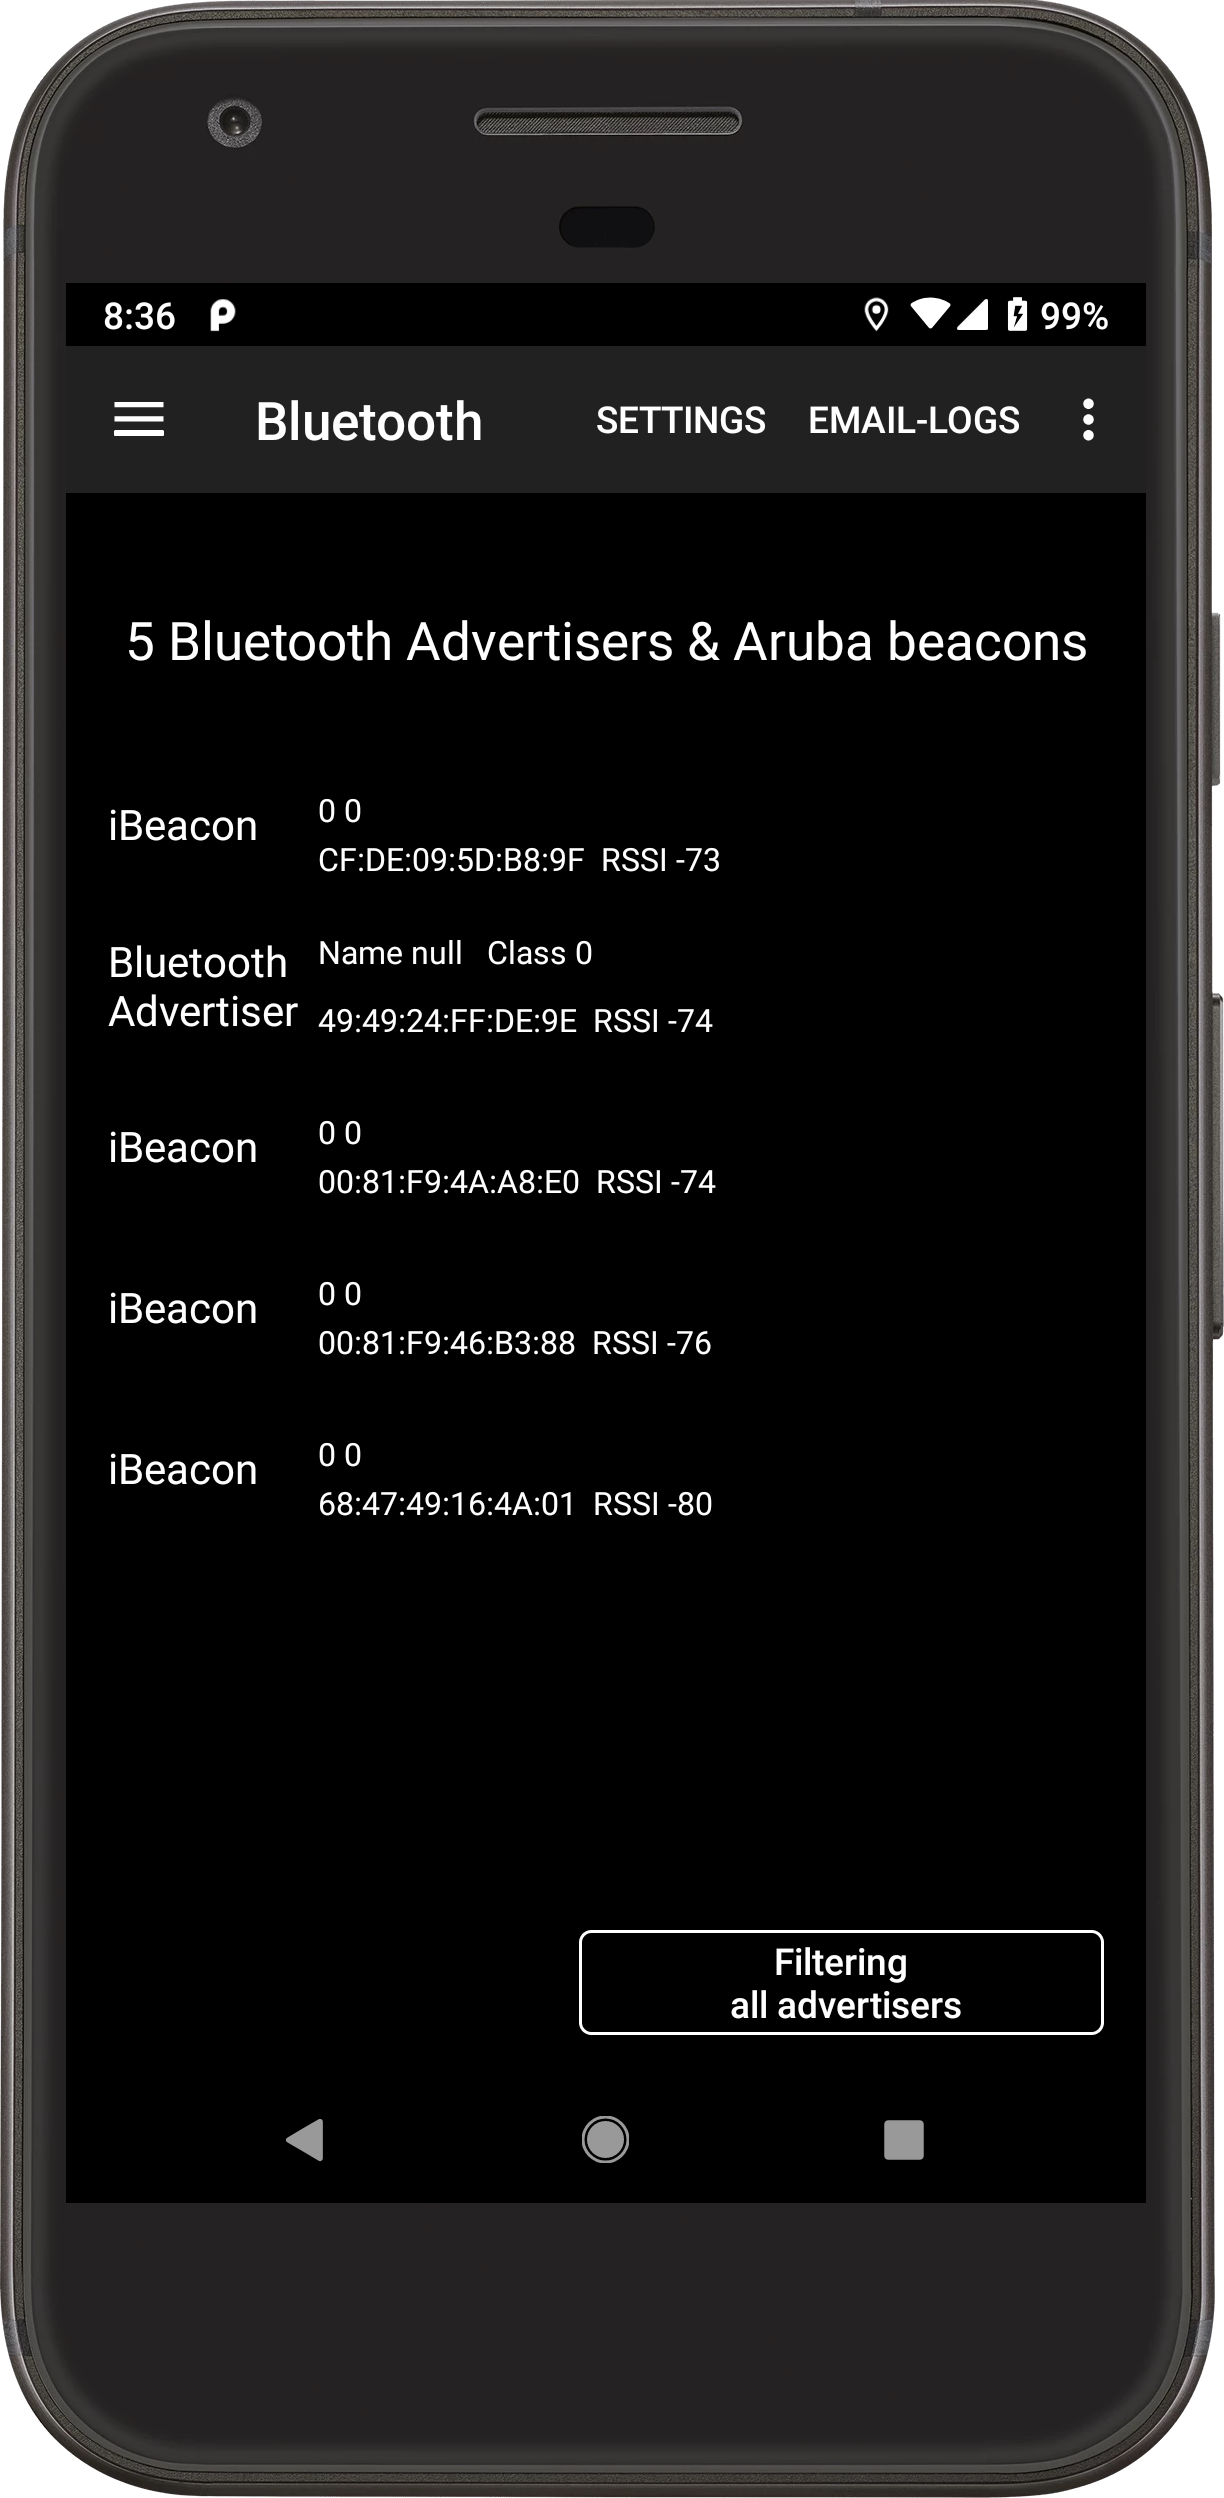
Turn on Enable Bluetooth Scanning in app settings and grant the Android permissions requested by the device. Hardware support for Bluetooth Low Energy is required.
02
Read a device
The list includes BLE advertisers, of which iBeacons are a subset. Touch an advertiser for details and approximately two-second signal updates; recognized Aruba beacon signatures receive additional interpretation.
03
Refresh
Android can throttle BLE scanning after a period of use. Refresh Scan restarts the scan when the list becomes stale.
08 / APP SCREEN
CBRS
Nearby LTE and band 48 information
SCREEN CAPTURE PENDINGHELP TEXT
▣CBRSScreen capture to be added
A current screenshot has not been supplied for this screen. The notes are based on the app’s Help.java text.
What to look for
01
Requirements
The tab requires Android 10 or later and a device with cellular hardware. CBRS band 48 also requires compatible radio hardware and a SIM that permits the band.
02
Read the results
The tab shows LTE network information reported by the phone's modem, including CBRS where available. The bands scanned depend on the SIM and device.
03
No results
An absent or disabled CBRS tab can indicate missing platform support. No app setting or button can add unsupported cellular hardware.
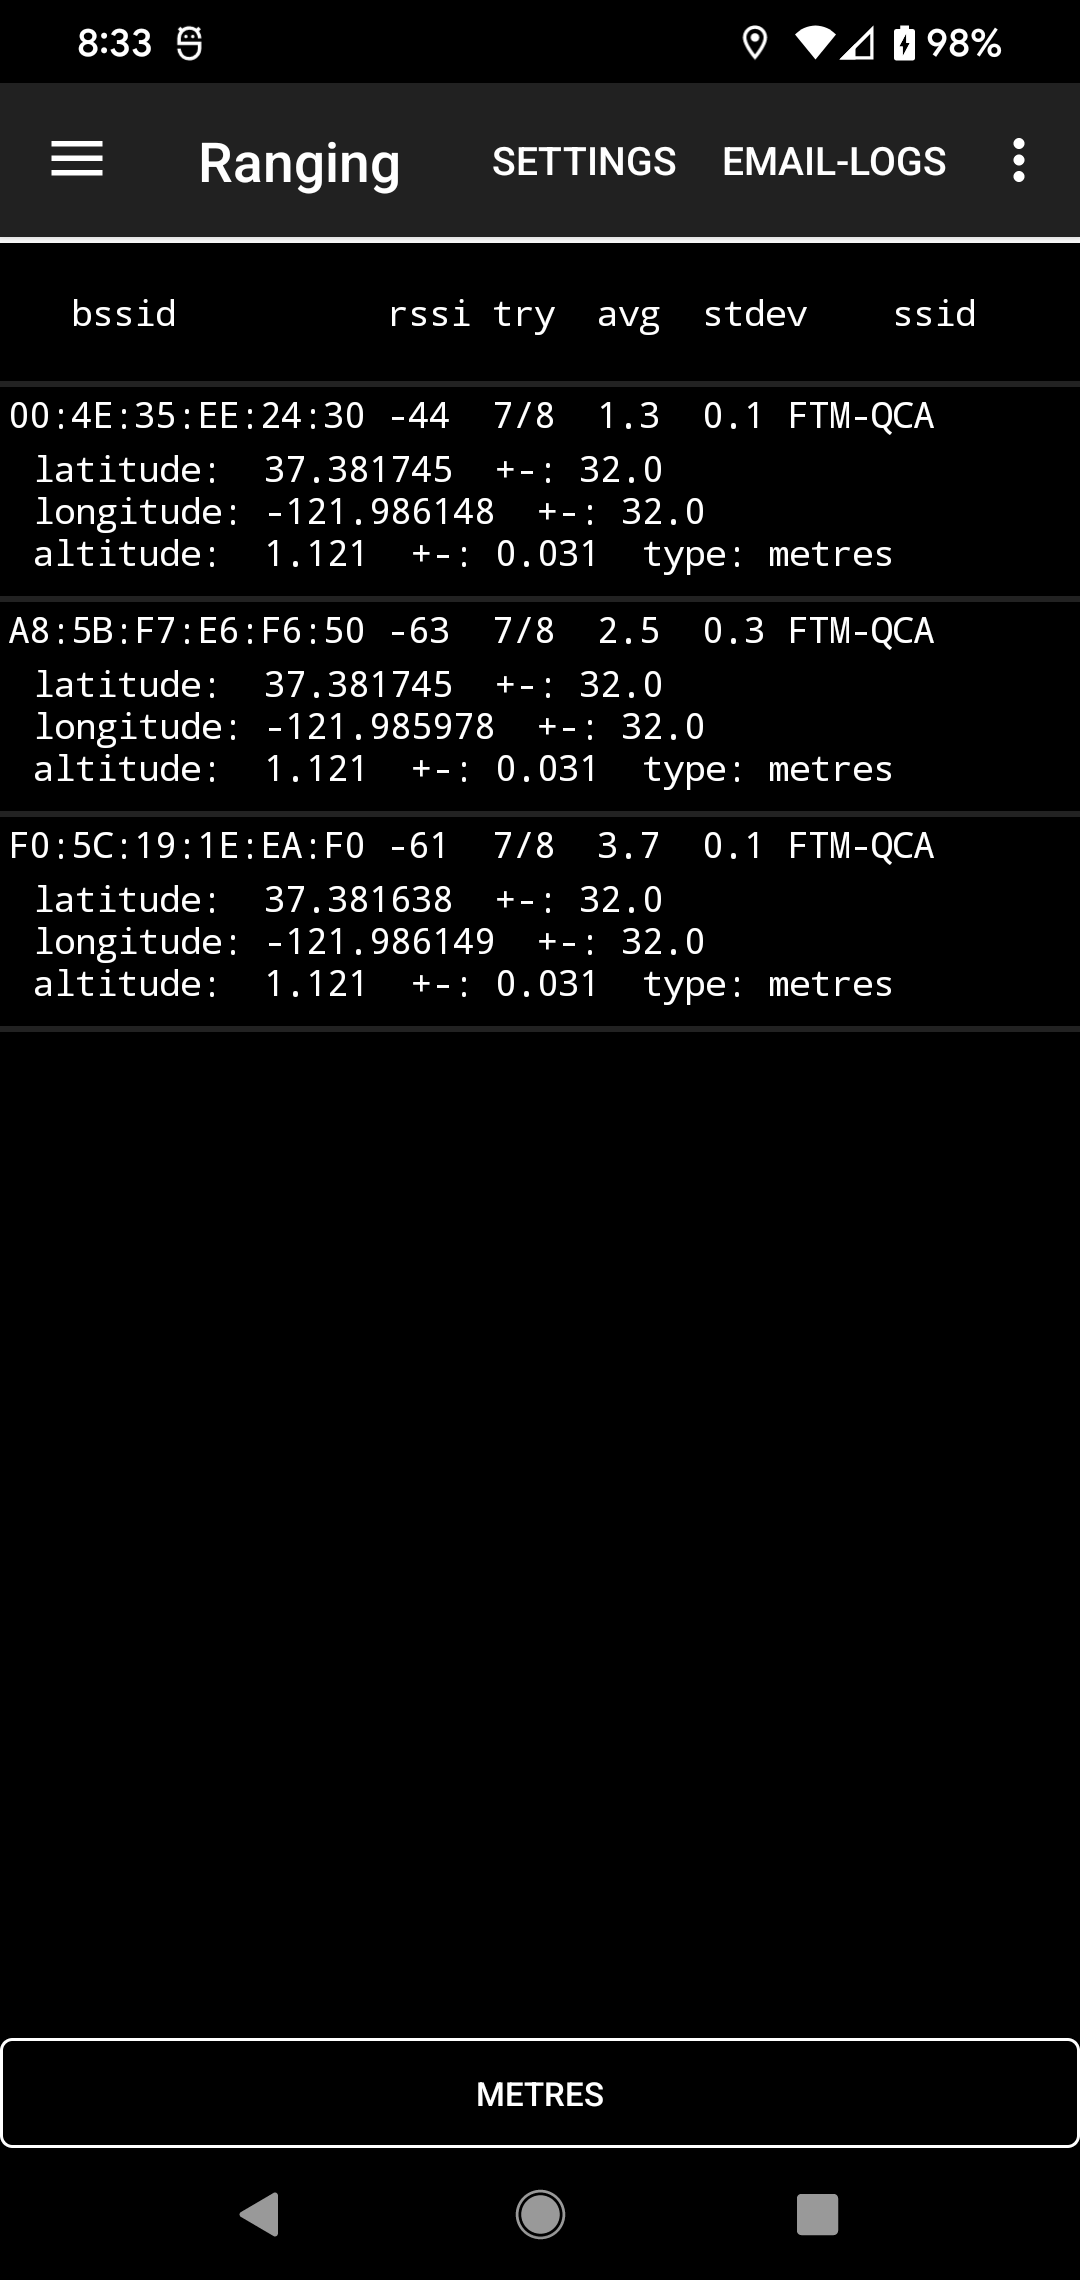
Android 9 or later, phone support for Wi-Fi RTT and a responding FTM/802.11mc access point are required. The tab attempts measurements only where both ends support ranging.
02
Read the table
Each responding AP row identifies the BSSID and signal, successful attempts, average estimated range and standard deviation. A lower standard deviation indicates closer agreement among those samples.
03
Units and availability
Use the bottom control to switch metres and feet. An empty result can be due to phone or AP support, permissions, or lack of a current scan result.
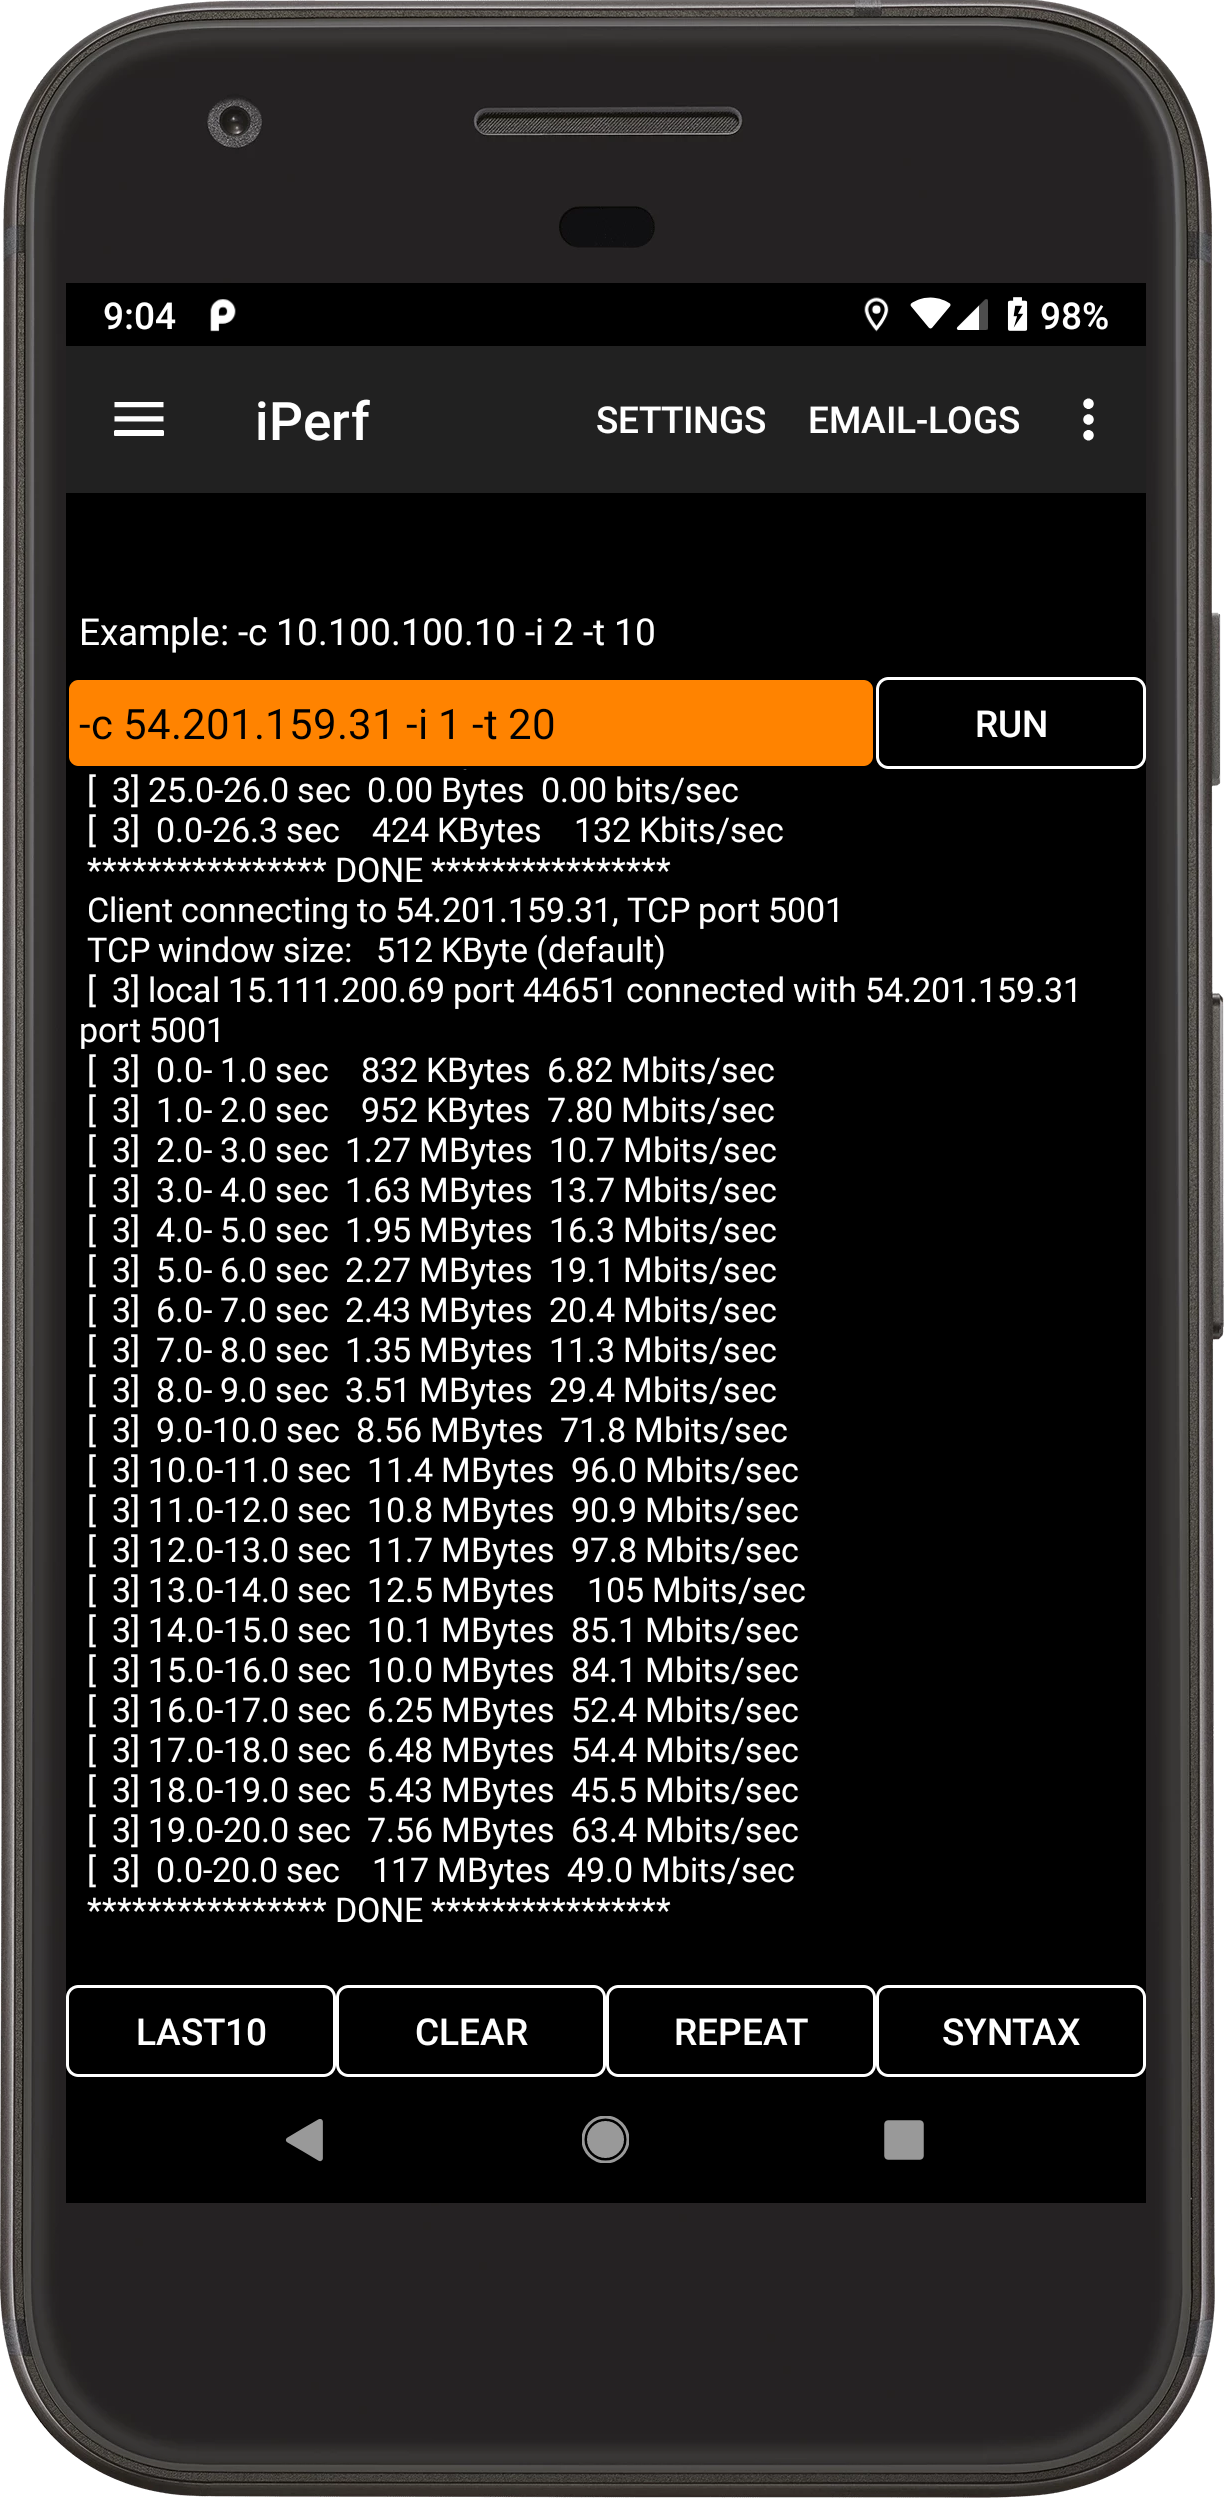
Run a compatible iPerf2 server on a reachable host, then enter an ordinary iPerf2 client command in the orange field. iPerf2 and iPerf3 peers are not interchangeable.
02
Run and interpret
Run executes the command; Last10 gives recent examples. An interval such as -i 2 produces periodic updates. The result measures the path to that peer, including any wired or internet segments.
03
If it stalls
Check server address, port, firewall and Wi-Fi reachability. Reset can recover a confused test process. The old sample cloud server address in earlier help is not a guaranteed endpoint.
11 / APP SCREEN
iPerf3
Throughput test with an iPerf3 peer
SCREEN CAPTURE PENDINGHELP TEXT
▣iPerf3Screen capture to be added
A current screenshot has not been supplied for this screen. The notes are based on the app’s Help.java text.
What to look for
01
Choose the peer
Enter an iPerf3 command in the orange field and use a reachable iPerf3 peer. The command is remembered and Last10 provides examples; --help shows syntax.
02
Test options
iPerf3 offers reverse (-R), bidirectional (--bidir) and multiple parallel streams (-P). Its ordinary output updates about once a second; interpret results as end-to-end path measurements.
03
If it stalls
Check that the server is actually running iPerf3, then verify address, port and firewall. Reset can recover the client. Server mode is described as untested in the supplied app help.
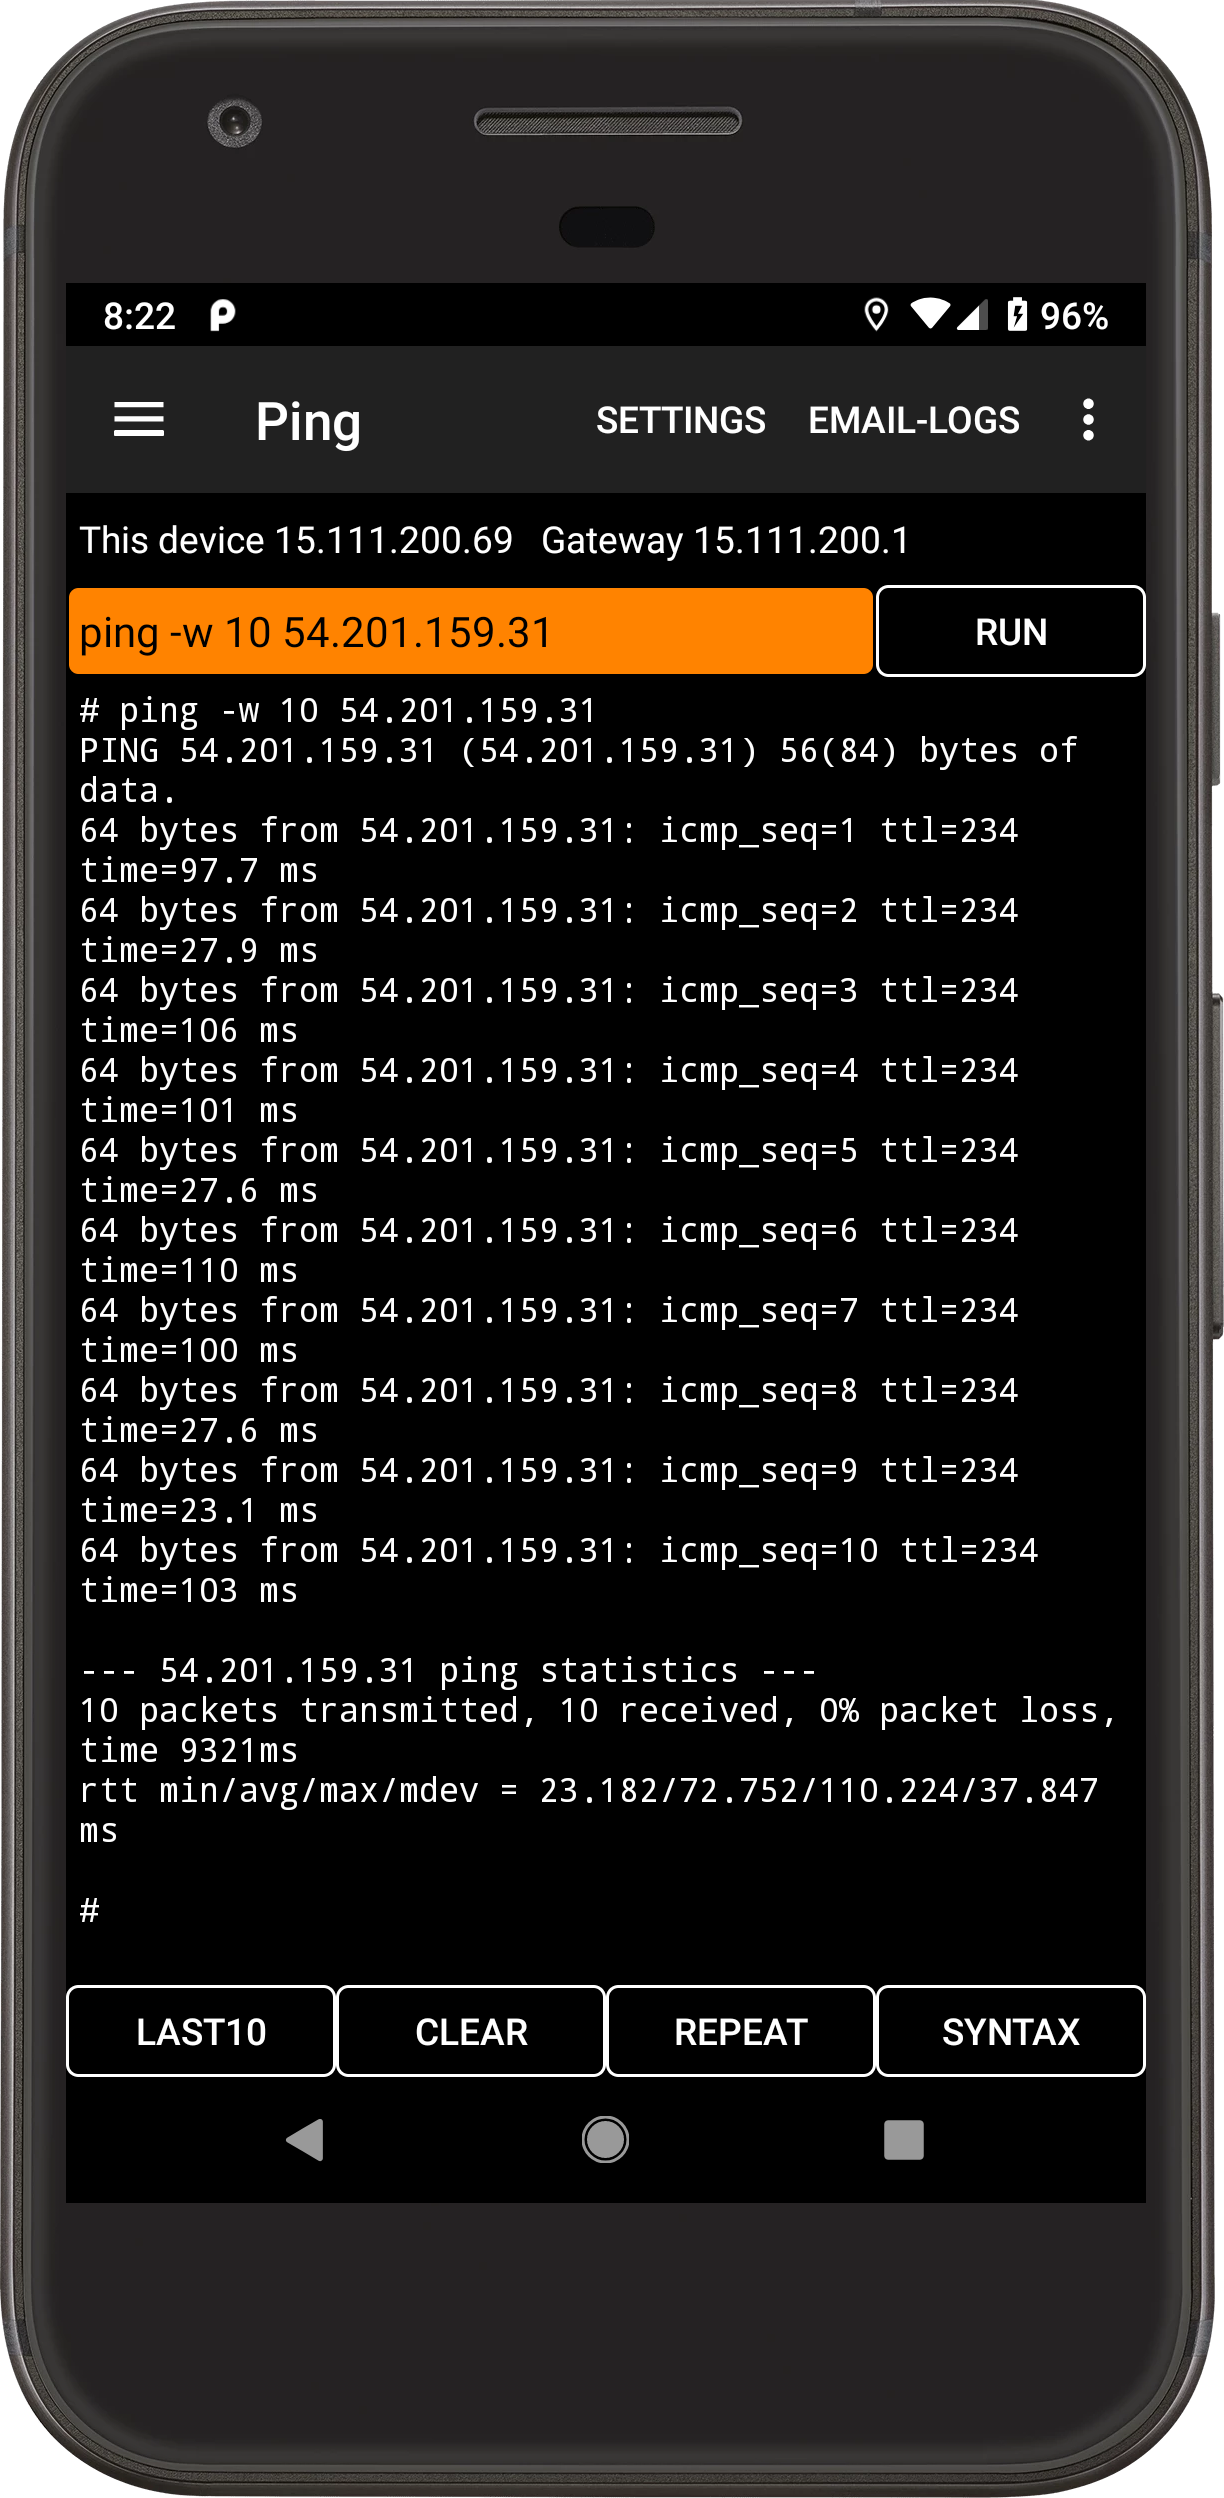
This separate Ping tab runs Android's standard ping command against the host you enter. The Wi-Fi Monitor's Start Ping control instead targets the current default gateway automatically.
02
Run the command
Enter a host or IP address, for example ping -c 10 10.1.1.1, then Run. The header shows the device and gateway addresses; those are context, not an automatic target for the typed command.
03
Interpret output
Replies report round-trip times; the summary reports packets sent and received, loss and latency statistics. Last10 recalls examples. Loss or delay alone does not identify which network segment caused it.
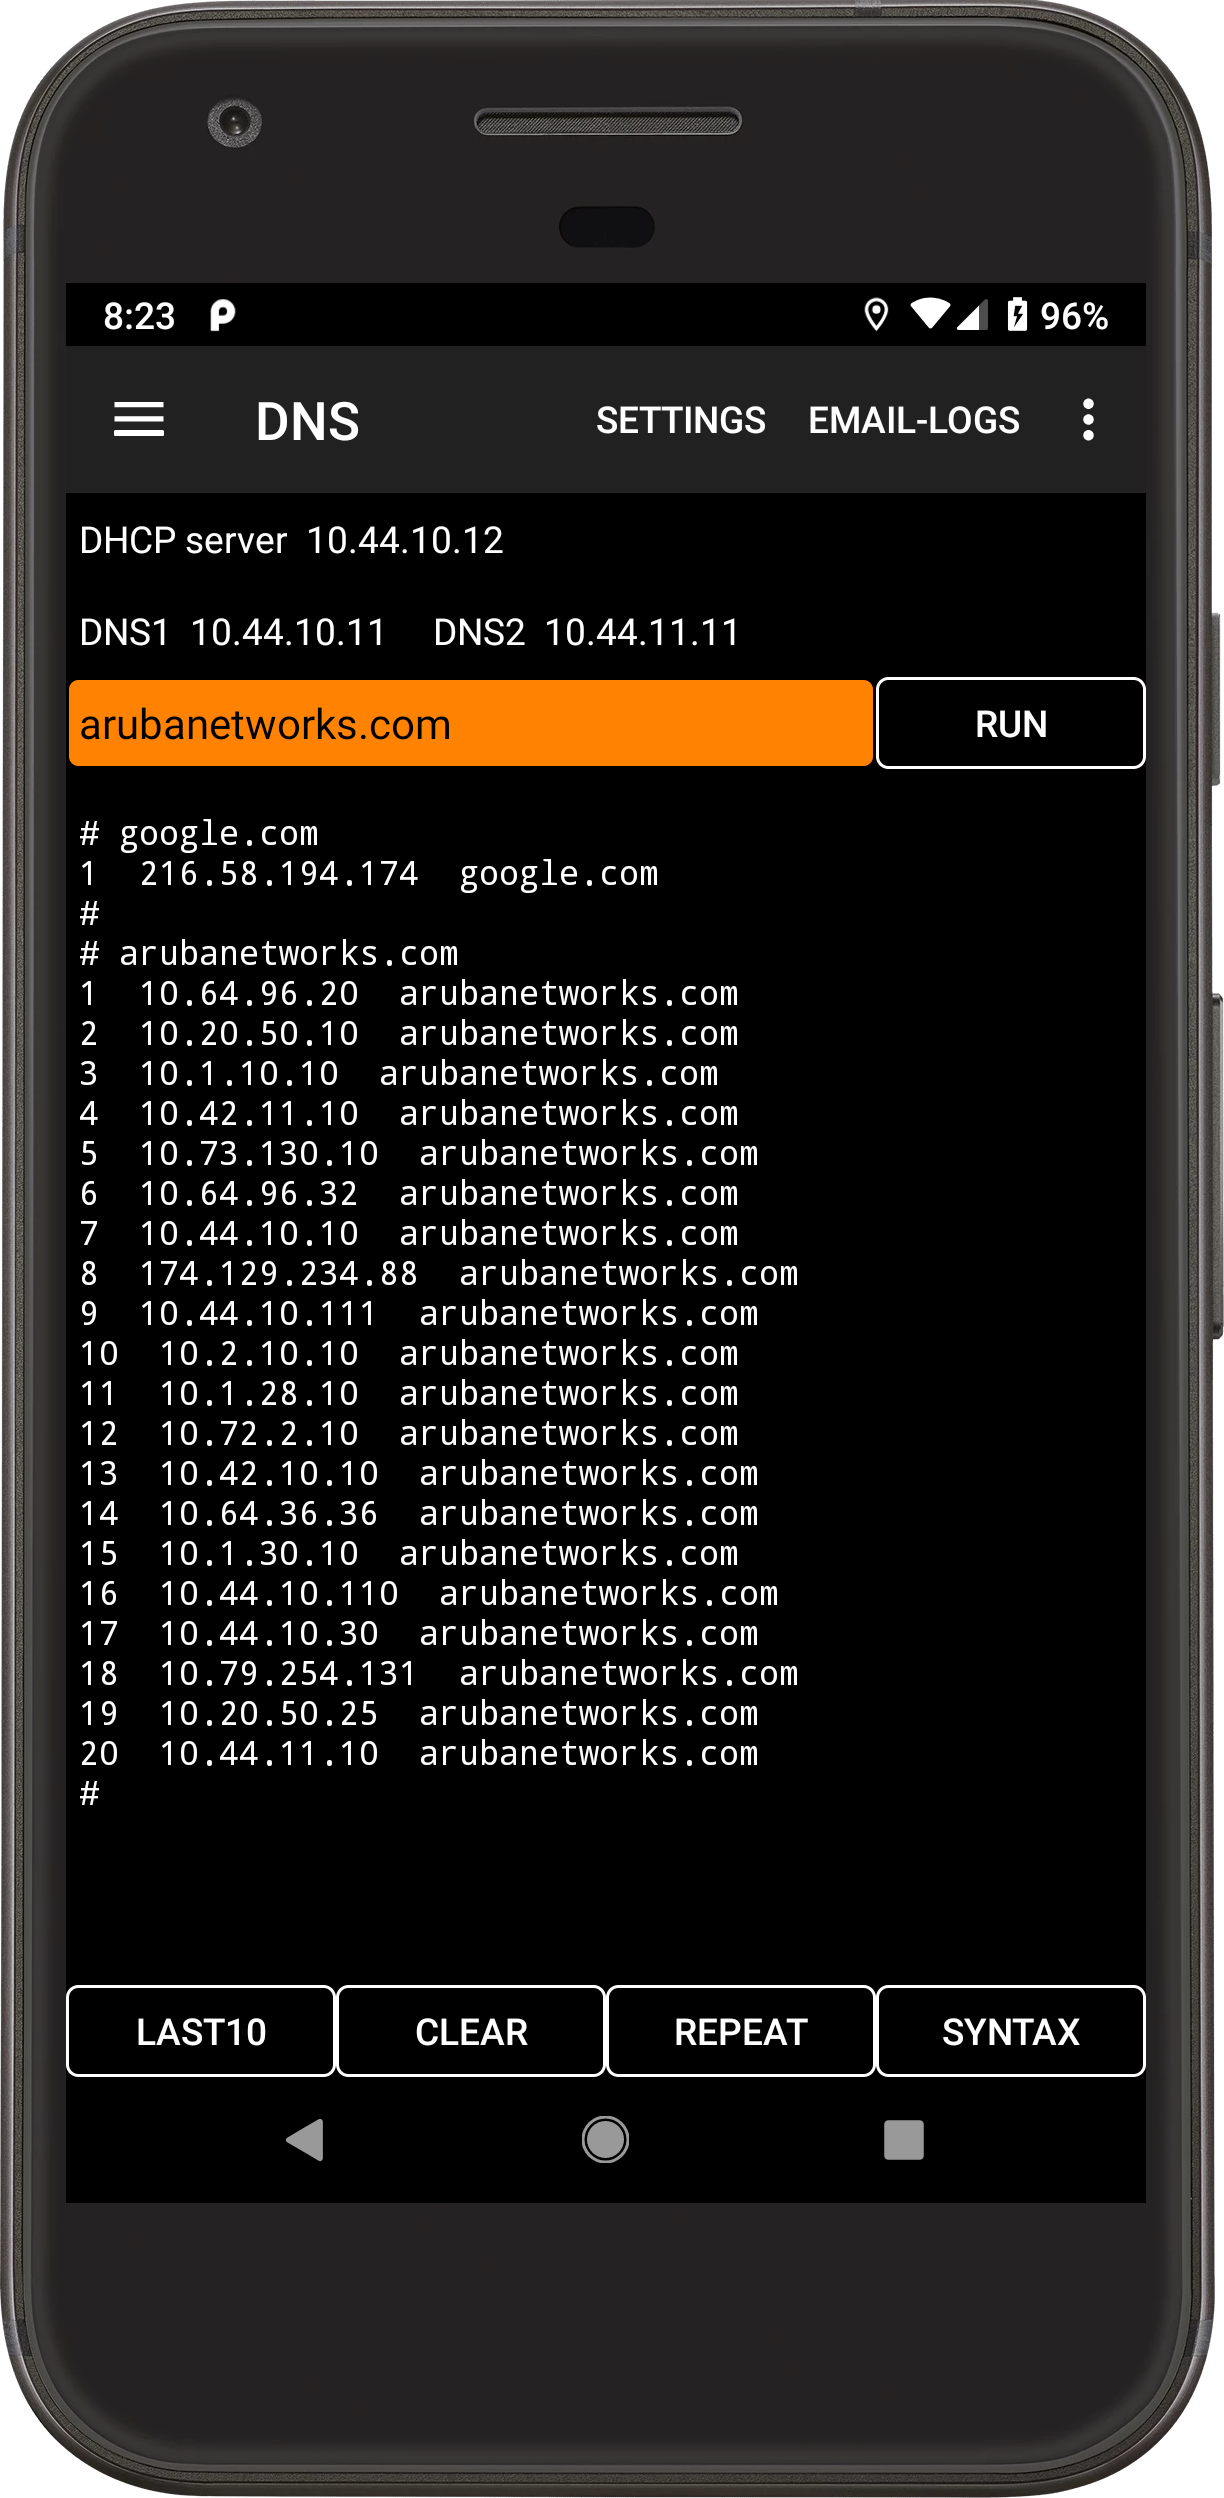
The screen shows DNS servers reported by Android. They may come from DHCP or static configuration; Android chooses a resolver for each lookup.
02
Lookups
Use the command field for forward (name to address) or reverse (address to name) queries, with IPv4 and IPv6 support where available. Last10 provides recent examples.
03
Diagnose
If an IP address responds to Ping while a name fails, compare the displayed resolver settings with the lookup result and the intended network configuration.
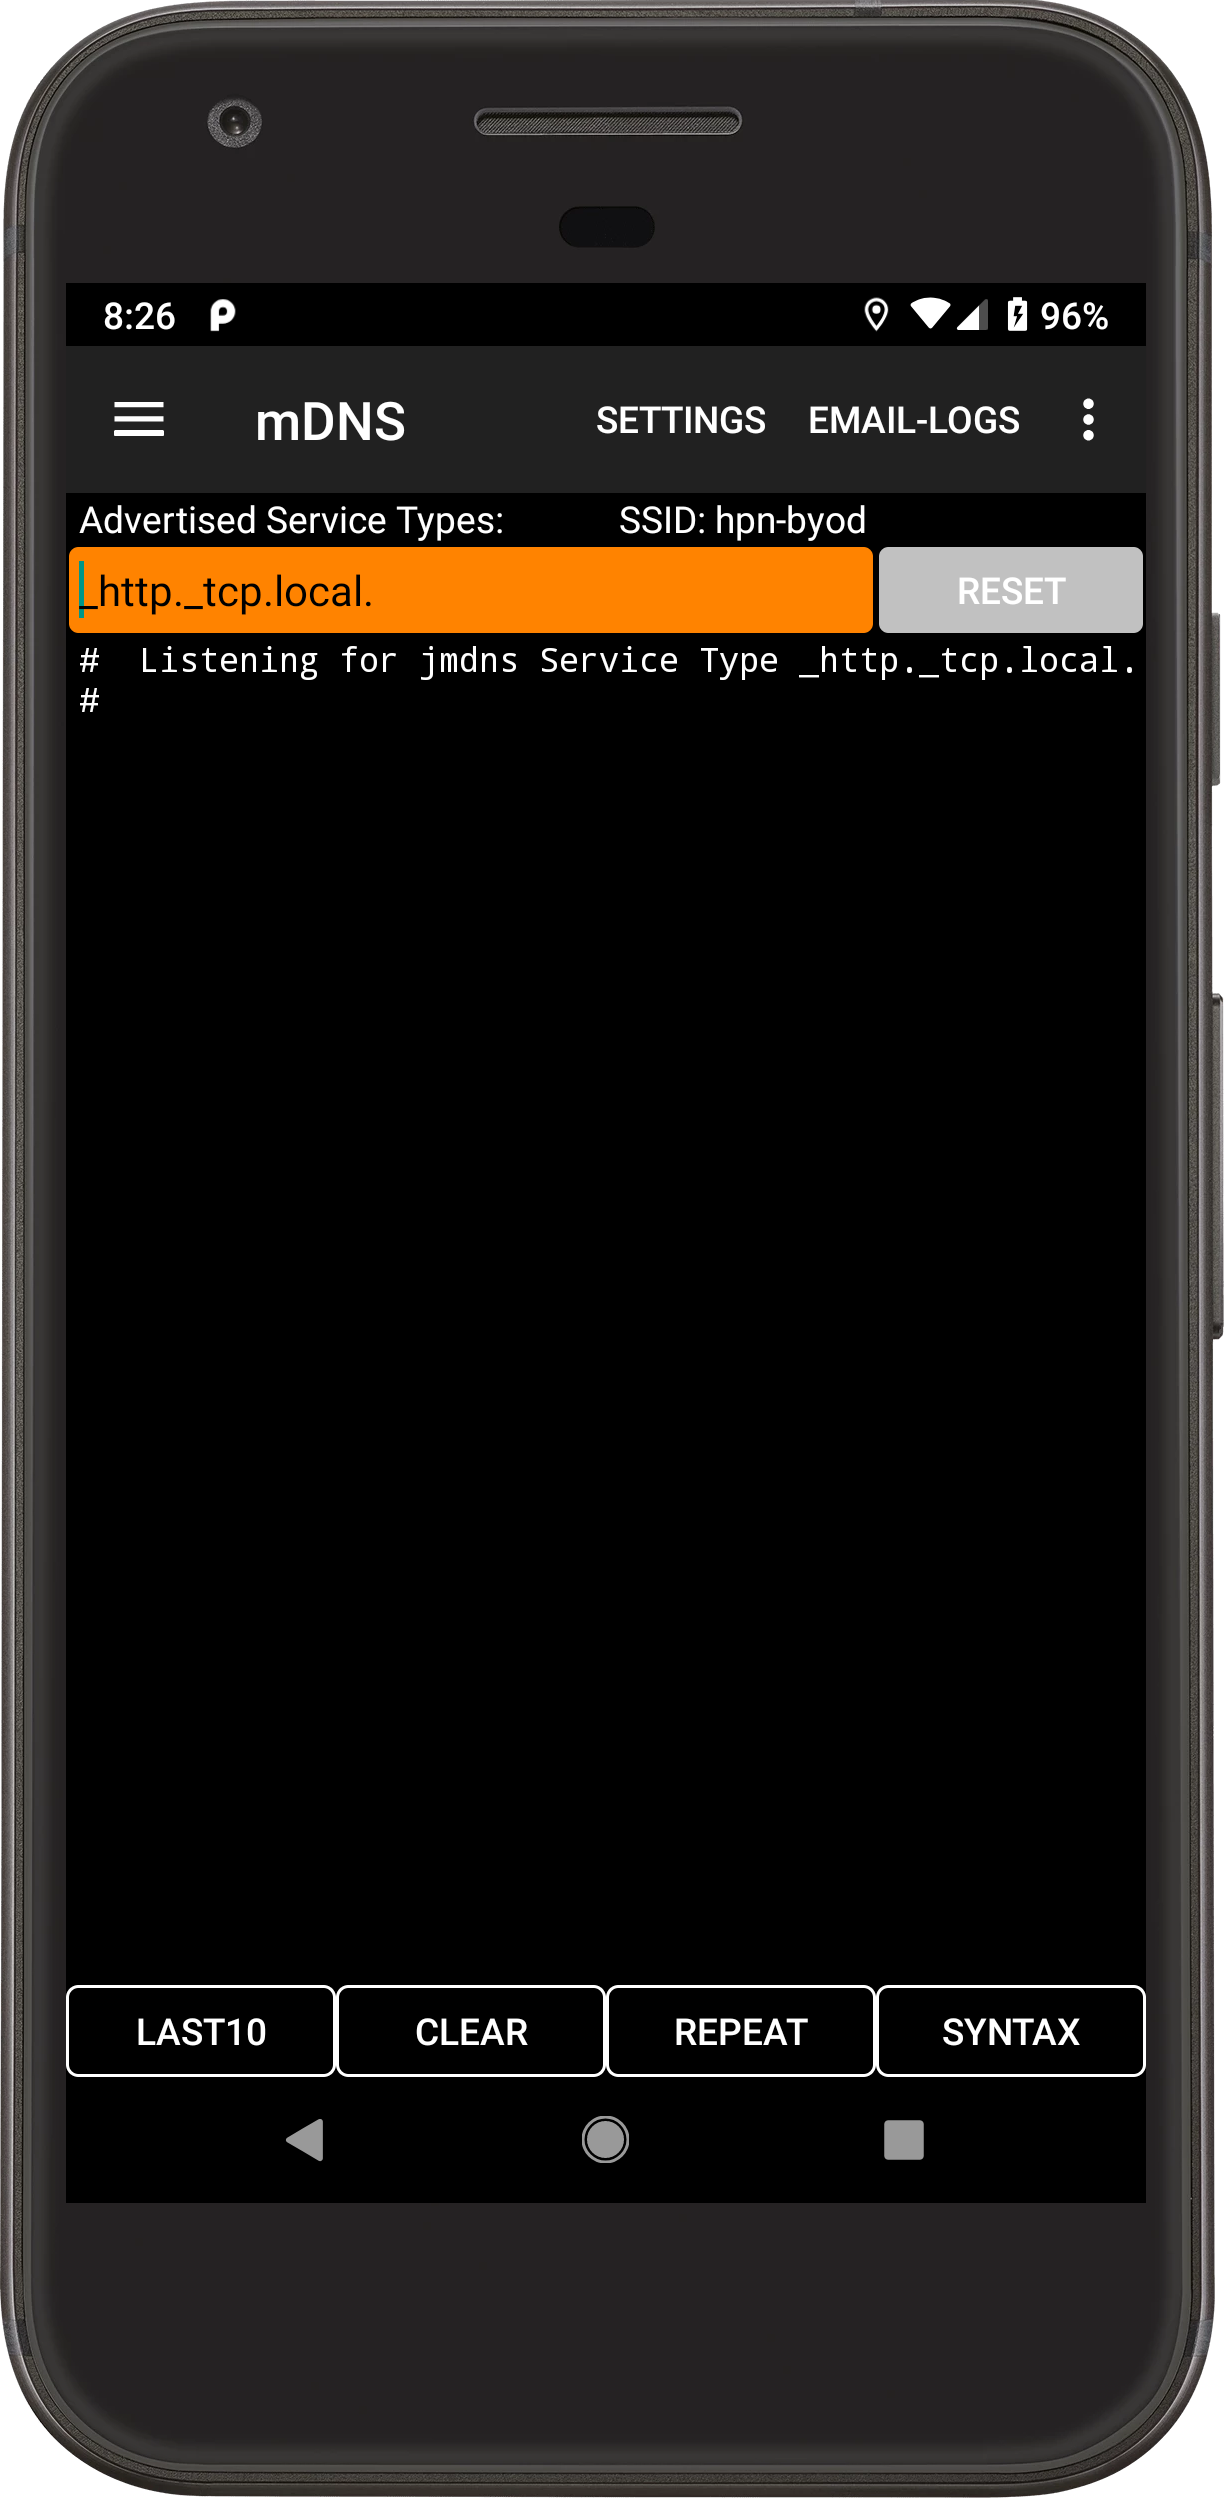
While the tab is visible it discovers advertised mDNS service types on the local network. Available types appear above the orange command field.
02
Query a type
Enter a valid type such as _workstation._tcp.local. ALL attempts to log all discovered service types; Last10 gives prior examples.
03
AirGroup caveat
Aruba AirGroup can suppress broad mDNS delivery until a specific type is requested. If ALL yields nothing on an AirGroup network, query the service type explicitly.
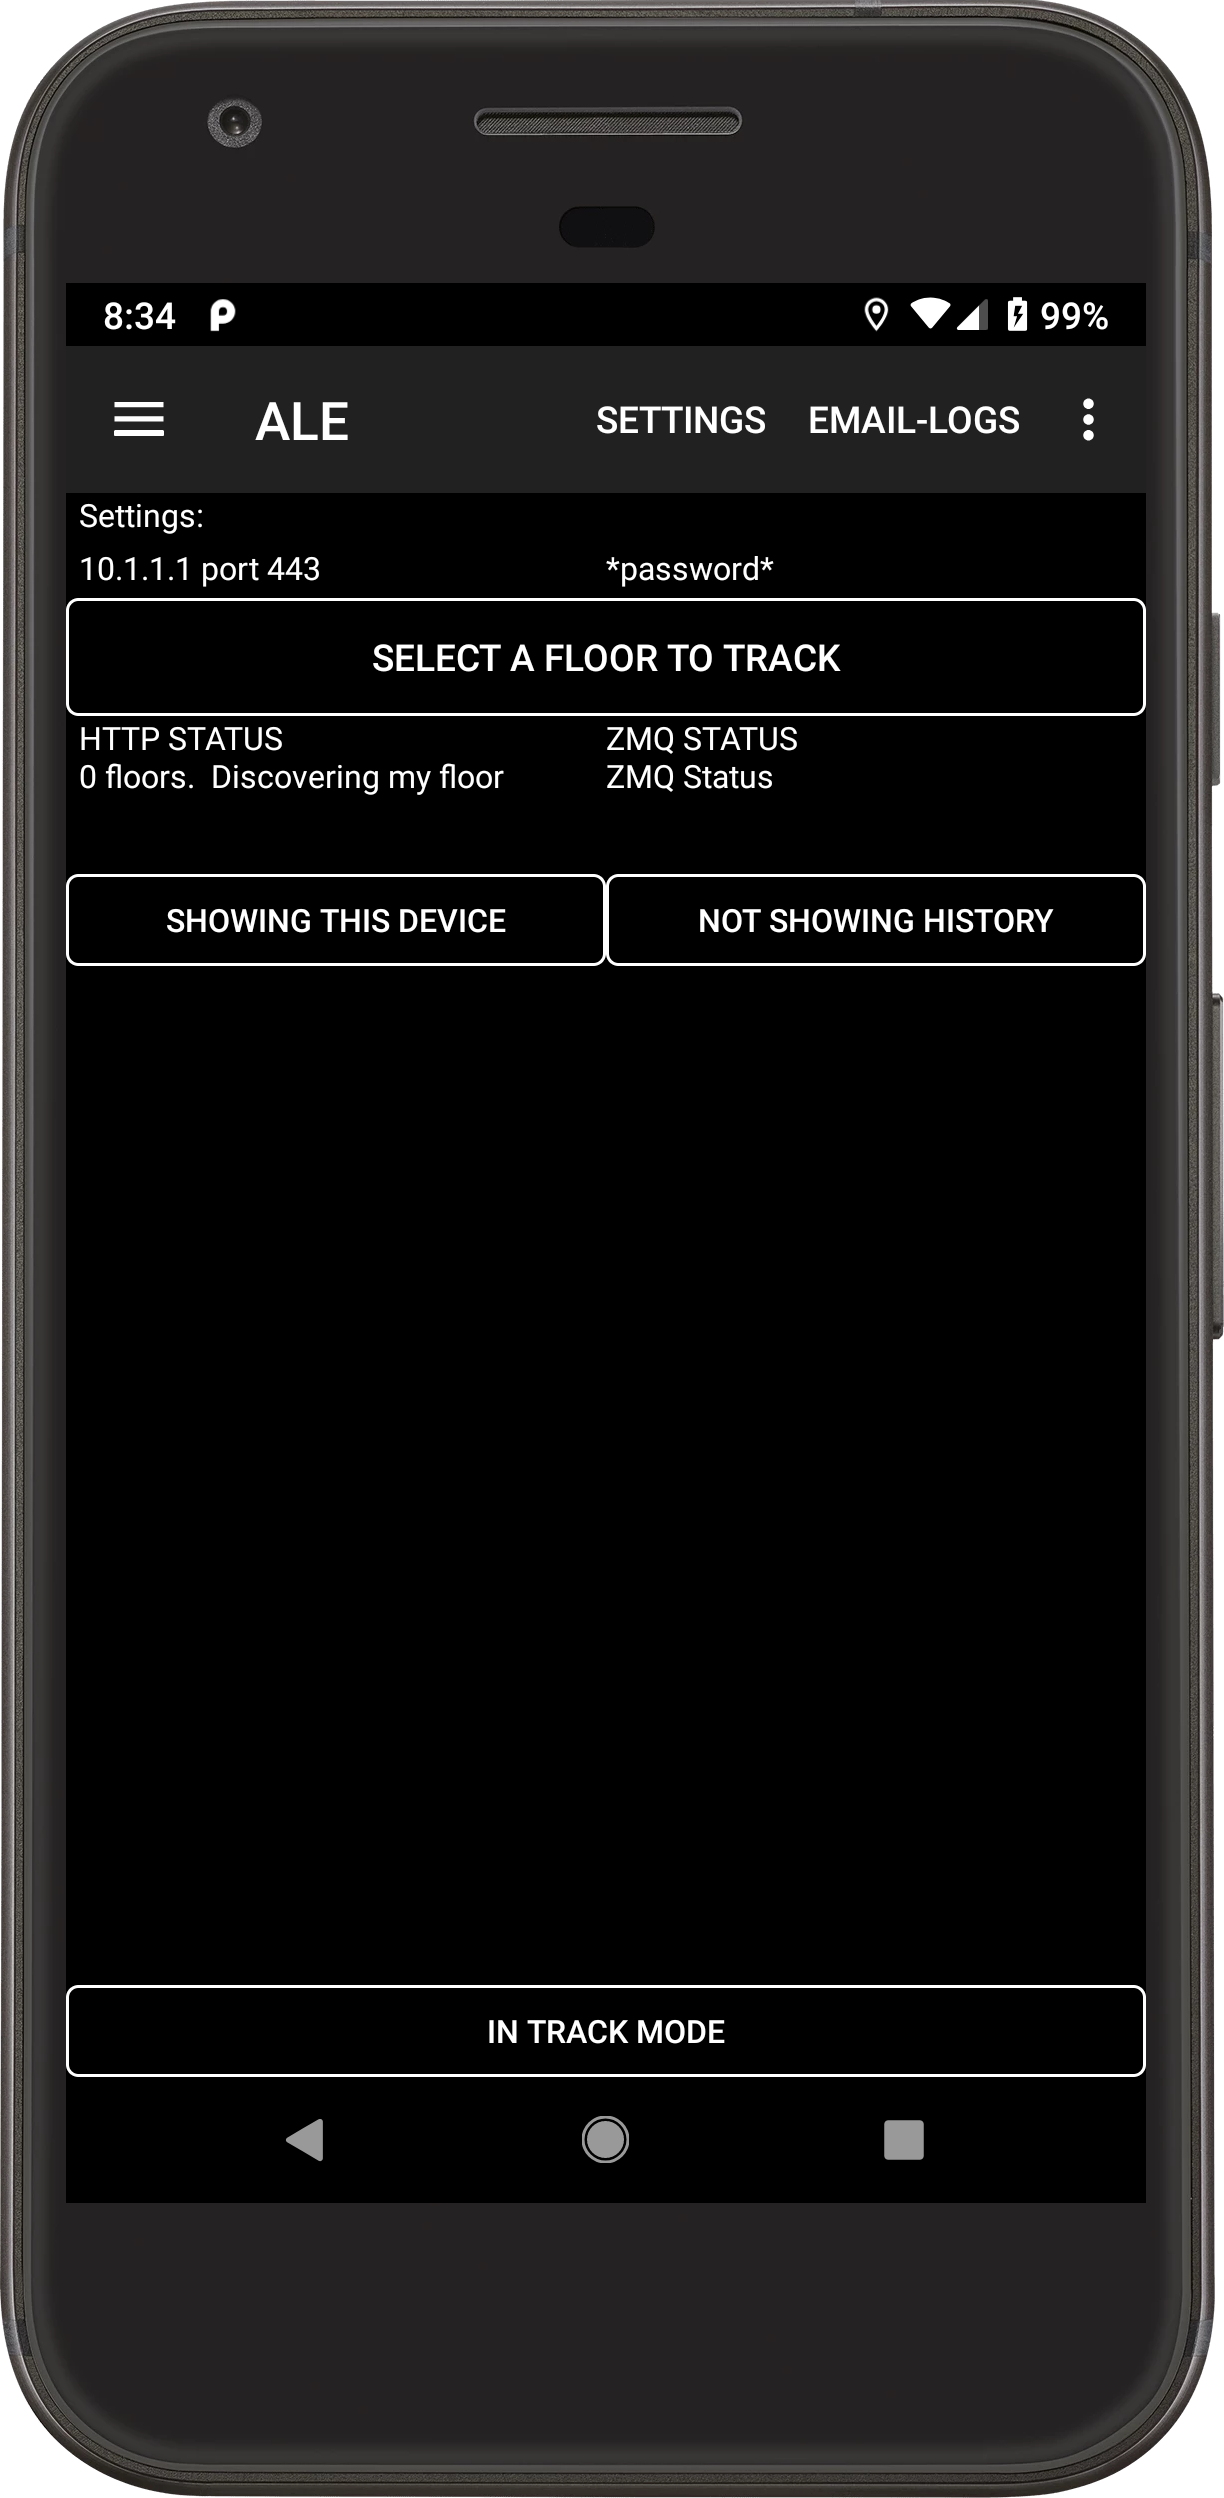
This tab targets ALE 2.0 or later. Touch the settings area above Floorplan to enter host, port, username and password. The floorplan download port is usually the same as the discovery port.
02
Floor and tracking
Floorplan selects a discovered floor. Showing All changes visible targets; Showing History shows tracks. Track Mode updates target movements. ZMQ event delivery can be disabled for large networks.
03
Verify
Verify Mode compares a user-entered true location with ALE's last reported location. Email Logs exports those comparisons as CSV. Reset clears the tab's configuration and history.
SUPPORT
Troubleshooting
First checks for common failures; exact Android permission labels vary by release.
Wi-Fi scans or neighbors are missing
Check Wi-Fi and Location on the phone, grant the app the Android permissions requested for nearby Wi-Fi information, and let a new scan complete. Verify the “last scan” age in Wi-Fi Monitor and check whether Filter Scan Results is hiding other SSIDs. Android may restrict scan frequency.
Gateway ping is red or the manual Ping tab fails
Check the phone's connection, IP address and default gateway. In Wi-Fi Monitor, Start Ping targets that gateway; in the Ping tab, the typed command chooses the target. Compare signal, channel and event history with reply times. A failed test can reflect the target or route as well as Wi-Fi.
iPerf cannot connect
Use an iPerf2 server for iPerf2 and an iPerf3 server for iPerf3. Check server address, port, reachability and firewall; use a server you control for a local WLAN measurement. The legacy example cloud endpoint in the supplied help is not guaranteed to remain available.
BLE, CBRS or ranging produces no data
Check the radio and Android permissions first. BLE requires supported hardware; CBRS requires cellular support and the appropriate SIM/band; Wi-Fi ranging requires a capable phone and FTM AP. Recheck scan freshness before assuming a nearby device is absent.
Send a useful support report
Include app version, phone model, Android version, the tab, steps to reproduce and expected versus observed behavior. Use Email Log if helpful, and review logs or screenshots for site identifiers before sending.
Aruba Utilities is an independent project by Peter Thornycroft, not an official HPE Aruba Networking support service.
Information on the device
The app reads Android network and device information needed for its screens, including Wi-Fi scans, connection details and, when enabled, Bluetooth or location information. The app help explains that Location enables Wi-Fi and Bluetooth scans and GPS, Storage can allow a gallery image as a floorplan, and phone-state access can display cellular identifiers on the Device screen. Permissions vary by Android release and feature.
Requests and reports
Routine measurements are displayed on the device. Functions you initiate can communicate with a controller, AirWave, Central, ALE, DNS host, ping target, iPerf peer or other endpoint; those systems can receive the necessary requests and may log them. Email Log and survey export prepare content for you to review and address in your email app. The developer can receive information you choose to email and anonymous crash reports provided through the Google Play Developer Console.
Website
This website has no form, advertising or page analytics. The web server may retain ordinary access logs. Review exported material for SSIDs, BSSIDs, IP addresses and location details before sharing it.
This guide is based on the developer's app help and presentation and may be updated as the app evolves.